View Lakehouse Monitoring expenses
Preview
This feature is in Public Preview.
This article shows you how to track your Lakehouse Monitoring expenses. You can check expenses using a query or using the billing portal.
View usage from the system table system.billing.usage
You can check Lakehouse Monitoring expenses using the system table system.billing.usage. For more information, see Billable usage system table reference.
SELECT usage_date, sum(usage_quantity) as dbus
FROM system.billing.usage
WHERE
  usage_date >= DATE_SUB(current_date(), 30) AND
  sku_name like "%JOBS_SERVERLESS%" AND
  custom_tags["LakehouseMonitoring"] = "true"
GROUP BY usage_date
ORDER BY usage_date DESC
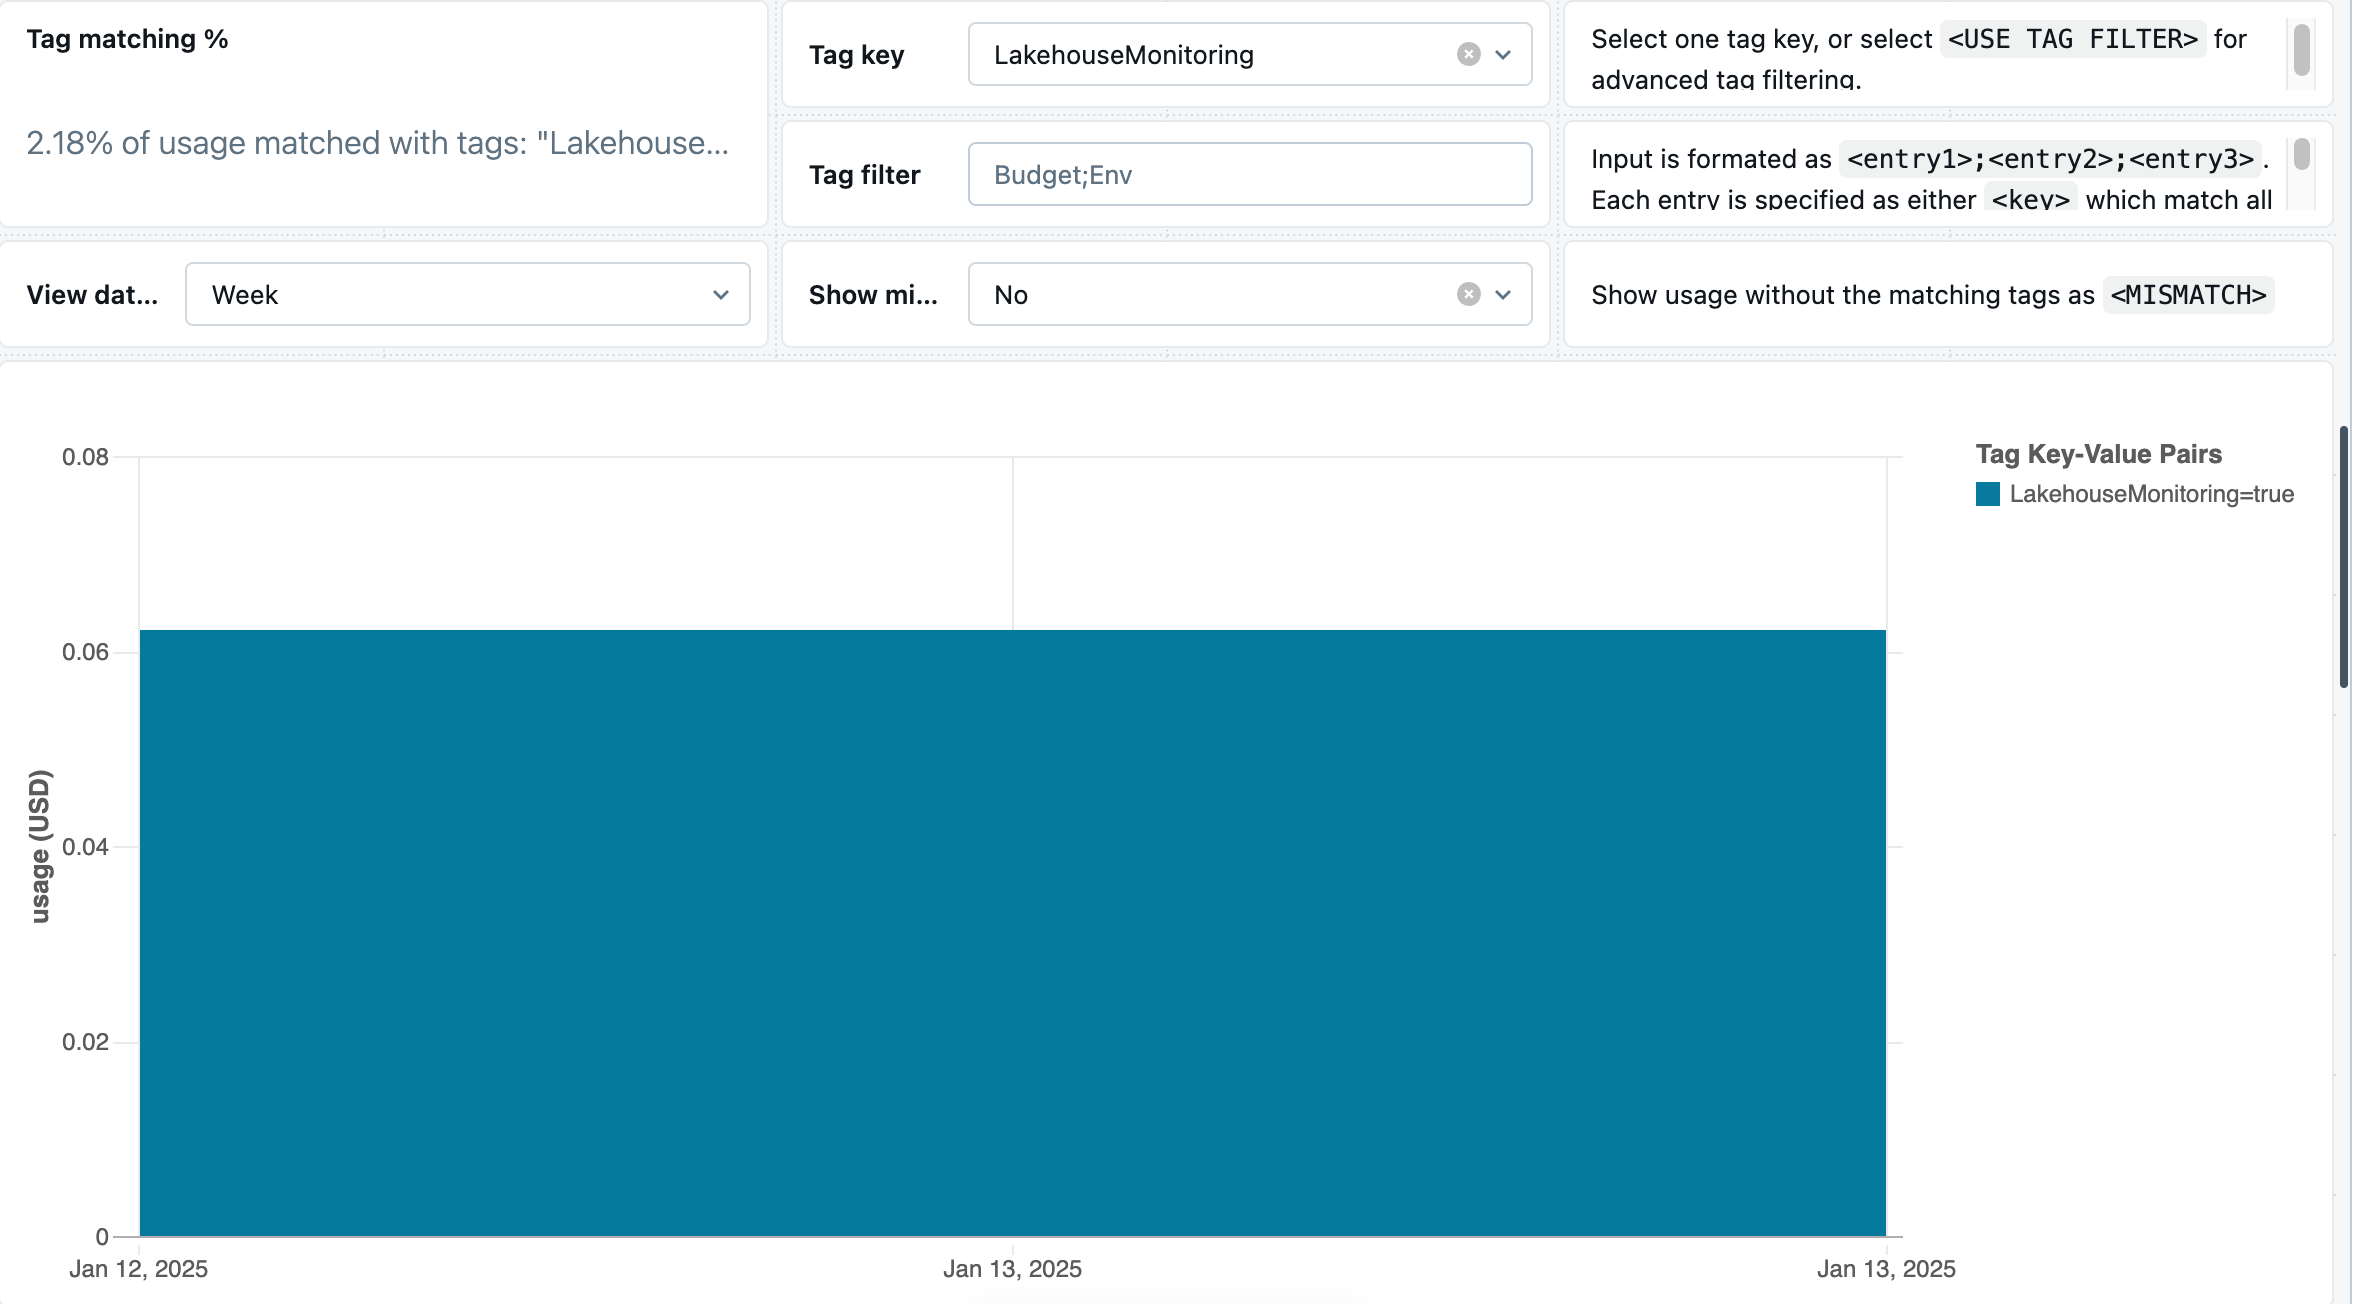
View usage from the billing portal
You can also check Lakehouse Monitoring expenses using the billing portal.
Log in to Databricks account console.
In the sidebar, click the Usage icon.
On the Usage page, select Consumption.
Select Setup dashboard icon.
In the Tag Key drop-down menu, select LakehouseMonitoring.
