Collaborate with colleagues using the new SQL editor
Preview
This feature is in Public Preview.
The built-in SQL editor in the Databricks UI has been redesigned to enhance collaboration and introduce new features to boost SQL development speed. Much of the basic querying and visualization functionality remains the same as in the classic SQL editor.
This article explains how to access the new SQL editor, manage queries and permissions, and use the new features available in the UI. To learn more about basic functionality like authoring queries, browsing available data, and creating visualizations, see Write queries and explore data in the SQL editor.
Access the new SQL editor
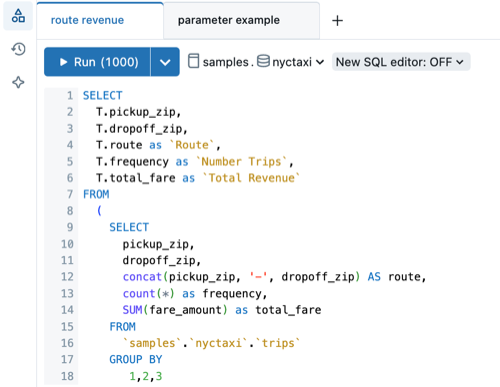
If the new query editor is enabled for your workspace, a New SQL editor toggle appears to the right of the catalog and schema drop-down selectors. On narrow displays, you can find the New SQL editor toggle by clicking the kebab menu  to the right of the catalog and schema selectors.

You can enable the new editor for any query that you own. To do so, use the following steps:
Click New SQL editor: OFF. A New SQL editor popover menu opens.
The Apply to all of my queries checkbox is selected by default. Keep this setting to enable the editor for all queries that you own.
To enable the new editor for the active query only, unselect the Apply to all of my queries checkbox.
Set the New SQL editor toggle to ON.
The new SQL editor cannot be used for all queries. You cannot switch to the new SQL editor for a query if any of the following are true:
You do not own the query.
The query contains Query-based Dropdown List or Range parameter types, which are not supported. See Work with query parameters.
When you turn on the new SQL editor, your query reopens in the new UI. The result set is empty until you run the query.
Note
Query results are shared with all collaborators.
Source control a query
Databricks SQL query files (extension: .dbquery.ipynb) are supported in Databricks Git folders. You can use a Git folder to source control your query files and to share them in other workspaces with Git folders that access the same Git repository. If you choose to opt out of the new SQL editor after committing or cloning a query in a Databricks Git folder, delete and reclone that Git folder to avoid unexpected behaviors.
Save a query
Query content in the new SQL editor is continuously autosaved. The Save button controls whether the draft query content should be applied to related assets, like legacy dashboards, Workflows, or alerts. If the query is shared with the Run as owner credential, only the query owner can use the Save button to propagate changes. If the credential is set to Run as viewer, any user with at least CAN MANAGE permission can save the query.
Collaborate on queries in real time

After sharing the query, you can coauthor or debug queries live through collaborative editing. Editors can also comment on individual lines of code to ask questions or add suggestions.
Orientation
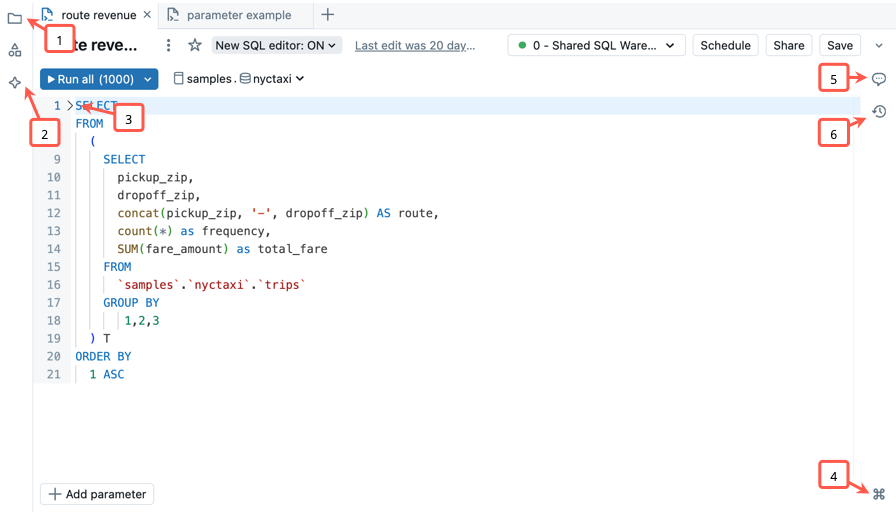
This section highlights key differences in the UI and explains how to find and use available features.

Access the workspace file system: You can access and organize your workspace objects directly from the SQL editor.
Use the integrated Databricks Assistant: Chat with the assistant to help you write, refine, or understand queries. Run code generated by the assistant from the side panel.
Collapse sections of code: Click the collapse arrow to the left of a code block to selectively hide and expand code sections. This can make working through large files easier.
Open the command palette: The command palette includes common actions, keyboard shortcuts, custom themes, and links to help you quickly find what you need. After you open it, use the search bar to look for specific tools and shortcuts.
Comment on code: Add comments to code to enhance collaboration.
Review version history: Review recent changes to your query.
Use keyboard shortcuts
The new SQL editor includes many built-in keyboard shortcuts to help you work quickly. The following table identifies commonly used keyboard shortcuts.
Function |
macOS shortcut |
Windows shortcut |
|---|---|---|
Run a query |
|
|
Run a single highlighted statement |
|
|
Autocomplete |
|
|
Increase font size |
|
|
Decrease font size |
|
|
Format SQL code |
|
|
View all shortcuts |
|
|
Explore all results
You can compare the output from each statement with multiple result statements. When you run multiple SQL statements from a single edit window, you can use the UI in the Output panel near the bottom of the screen to scroll through the different result sets.

Parameter syntax changes
Queries that use double curly braces ({{}}) to indicate parameters must be modified to run in the new SQL editor. The new SQL editor uses the same parameter syntax as other Databricks tools, like AI/BI dashboards, AI/BI Genie, and notebooks.
Parameters in the new SQL editor are defined using named parameter syntax. Named parameters are parameters in a query that are prefixed with a colon, for example :parameter_name.
See Named parameter markers for the SQL referenece documentation. See Named parameter syntax examples for examples of converting parameter syntax from the classic SQL editor to named parameter markers.
Disable the new SQL editor
To disable the new SQL editor, use the following steps:
Click New SQL editor: ON. A New SQL editor popover menu opens.
Set the New SQL Editor toggle to OFF.
In the confirmation dialog, choose to disable the new editor for the active query only or for all eligible queries.
The Disable for all eligible queries is unselected. Keep this setting if you want to disable the new editor for only the active query.
To disable the new SQL editor for all your queries, select the checkbox Disable for all eligible queries.
Workspace admins can turn off the preview at the workspace level by visiting the preview portal. See Manage Databricks Previews.