SparkR overview
Important
SparkR in Databricks is deprecated in Databricks Runtime 16.0 and above. Databricks recommends using sparklyr instead.
SparkR is an R package that provides a light-weight frontend to use Apache Spark from R. SparkR also supports distributed machine learning using MLlib.
SparkR function reference
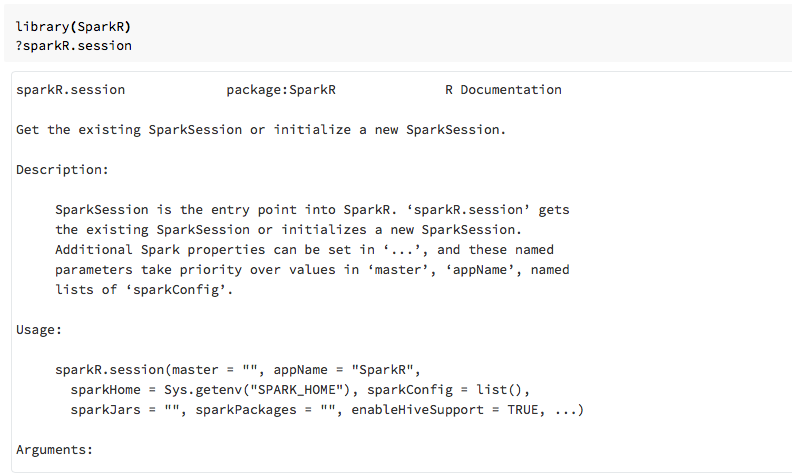
You can find the latest SparkR function reference on spark.apache.org.
You can also view function help in R notebooks or RStudio after you import the SparkR package.
SparkR in notebooks
For Spark 2.0 and above, you do not need to explicitly pass a
sqlContextobject to every function call.For Spark 2.2 and above, notebooks no longer import SparkR by default because SparkR functions were conflicting with similarly named functions from other popular packages. To use SparkR you can call
library(SparkR)in your notebooks. The SparkR session is already configured, and all SparkR functions will talk to your attached cluster using the existing session.
SparkR in spark-submit jobs
You can run scripts that use SparkR on Databricks as spark-submit jobs, with minor code modifications.
Create SparkR DataFrames
You can create a DataFrame from a local R data.frame, from a data source, or using a Spark SQL query.
From a local R data.frame
The simplest way to create a DataFrame is to convert a local R data.frame into a
SparkDataFrame. Specifically we can use createDataFrame and pass in the local R
data.frame to create a SparkDataFrame. Like most other SparkR functions, createDataFrame
syntax changed in Spark 2.0. You can see examples of this in the code snippet below.
For more examples, see createDataFrame.
library(SparkR)
df <- createDataFrame(faithful)

# Displays the content of the DataFrame to stdout
head(df)
Using the data source API
The general method for creating a DataFrame from a data source is read.df.
This method takes the path for the file to load and the type of data source.
SparkR supports reading CSV, JSON, text, and Parquet files
natively.
library(SparkR)
diamondsDF <- read.df("/databricks-datasets/Rdatasets/data-001/csv/ggplot2/diamonds.csv", source = "csv", header="true", inferSchema = "true")
head(diamondsDF)
SparkR automatically infers the schema from the CSV file.
Adding a data source connector with Spark Packages
Through Spark Packages you can find data source connectors for popular file formats such as Avro. As an example, use the spark-avro package to load an Avro file. The availability of the spark-avro package depends on your cluster’s version. See Avro file.
First take an existing data.frame, convert to a Spark DataFrame, and save it as an Avro file.
require(SparkR)
irisDF <- createDataFrame(iris)
write.df(irisDF, source = "com.databricks.spark.avro", path = "dbfs:/tmp/iris.avro", mode = "overwrite")
To verify that an Avro file was saved:
%fs ls /tmp/iris.avro
Now use the spark-avro package again to read back the data.
irisDF2 <- read.df(path = "/tmp/iris.avro", source = "com.databricks.spark.avro")
head(irisDF2)
The data source API can also be used to save DataFrames into
multiple file formats. For example, you can save the DataFrame from the
previous example to a Parquet file using write.df.
write.df(irisDF2, path="dbfs:/tmp/iris.parquet", source="parquet", mode="overwrite")
%fs ls dbfs:/tmp/iris.parquet
From a Spark SQL query
You can also create SparkR DataFrames using Spark SQL queries.
# Register earlier df as temp view
createOrReplaceTempView(irisDF2, "irisTemp")
# Create a df consisting of only the 'species' column using a Spark SQL query
species <- sql("SELECT species FROM irisTemp")
species is a SparkDataFrame.
DataFrame operations
Spark DataFrames support a number of functions to do structured data processing. Here are some basic examples. A complete list can be found in the API docs.
Select rows and columns
# Import SparkR package if this is a new notebook
require(SparkR)

# Create DataFrame
df <- createDataFrame(faithful)
# Select only the "eruptions" column
head(select(df, df$eruptions))
# You can also pass in column name as strings
head(select(df, "eruptions"))
# Filter the DataFrame to only retain rows with wait times shorter than 50 mins
head(filter(df, df$waiting < 50))
Grouping and aggregation
SparkDataFrames support a number of commonly used functions to aggregate data after grouping. For example you can count the number of times each waiting time appears in the faithful dataset.
head(count(groupBy(df, df$waiting)))
# You can also sort the output from the aggregation to get the most common waiting times
waiting_counts <- count(groupBy(df, df$waiting))
head(arrange(waiting_counts, desc(waiting_counts$count)))
Column operations
SparkR provides a number of functions that can be directly applied to columns for data processing and aggregation. The following example shows the use of basic arithmetic functions.
# Convert waiting time from hours to seconds.
# You can assign this to a new column in the same DataFrame
df$waiting_secs <- df$waiting * 60
head(df)
Machine learning
SparkR exposes most of MLLib algorithms. Under the hood, SparkR uses MLlib to train the model.
The following example shows how to build a gaussian GLM model using
SparkR. To run linear regression, set family to "gaussian". To run
logistic regression, set family to "binomial". When using SparkML GLM SparkR
automatically performs one-hot encoding of
categorical features so that it does not need to be done manually.
Beyond String and Double type features, it is also possible to fit over
MLlib Vector features, for compatibility with other MLlib components.
# Create the DataFrame
df <- createDataFrame(iris)

# Fit a linear model over the dataset.
model <- glm(Sepal_Length ~ Sepal_Width + Species, data = df, family = "gaussian")

# Model coefficients are returned in a similar format to R's native glm().
summary(model)
For tutorials, see Tutorial: Analyze data with glm.
For additional examples, see Work with DataFrames and tables in R.