Create a SQL warehouse
Workspace admins and sufficiently privileged users can configure and manage SQL warehouses. This article outlines how to create, edit, and monitor existing SQL warehouses.
You can also create SQL warehouses using the SQL warehouse API, or Terraform.
Note
Most users cannot create SQL warehouses, but can restart any SQL warehouse they can connect to. See Connect to a SQL warehouse.
Requirements
SQL warehouses have the following requirements:
To create a SQL warehouse you must be a workspace admin or a user with unrestricted cluster creation permissions.
Before you can create a serverless SQL warehouse in a region that supports the feature, there might be required steps. See Enable serverless SQL warehouses.
Create a SQL warehouse
To create a SQL warehouse using the web UI:
Click SQL Warehouses in the sidebar.
Click Create SQL Warehouse.
Enter a Name for the warehouse.
(Optional) Configure warehouse settings. See Configure SQL warehouse settings.
(Optional) Configure advanced options. See Advanced options.
Click Create.
(Optional) Configure access to the SQL warehouse. See Manage a SQL warehouse.
Your created warehouse starts automatically.
Configure SQL warehouse settings
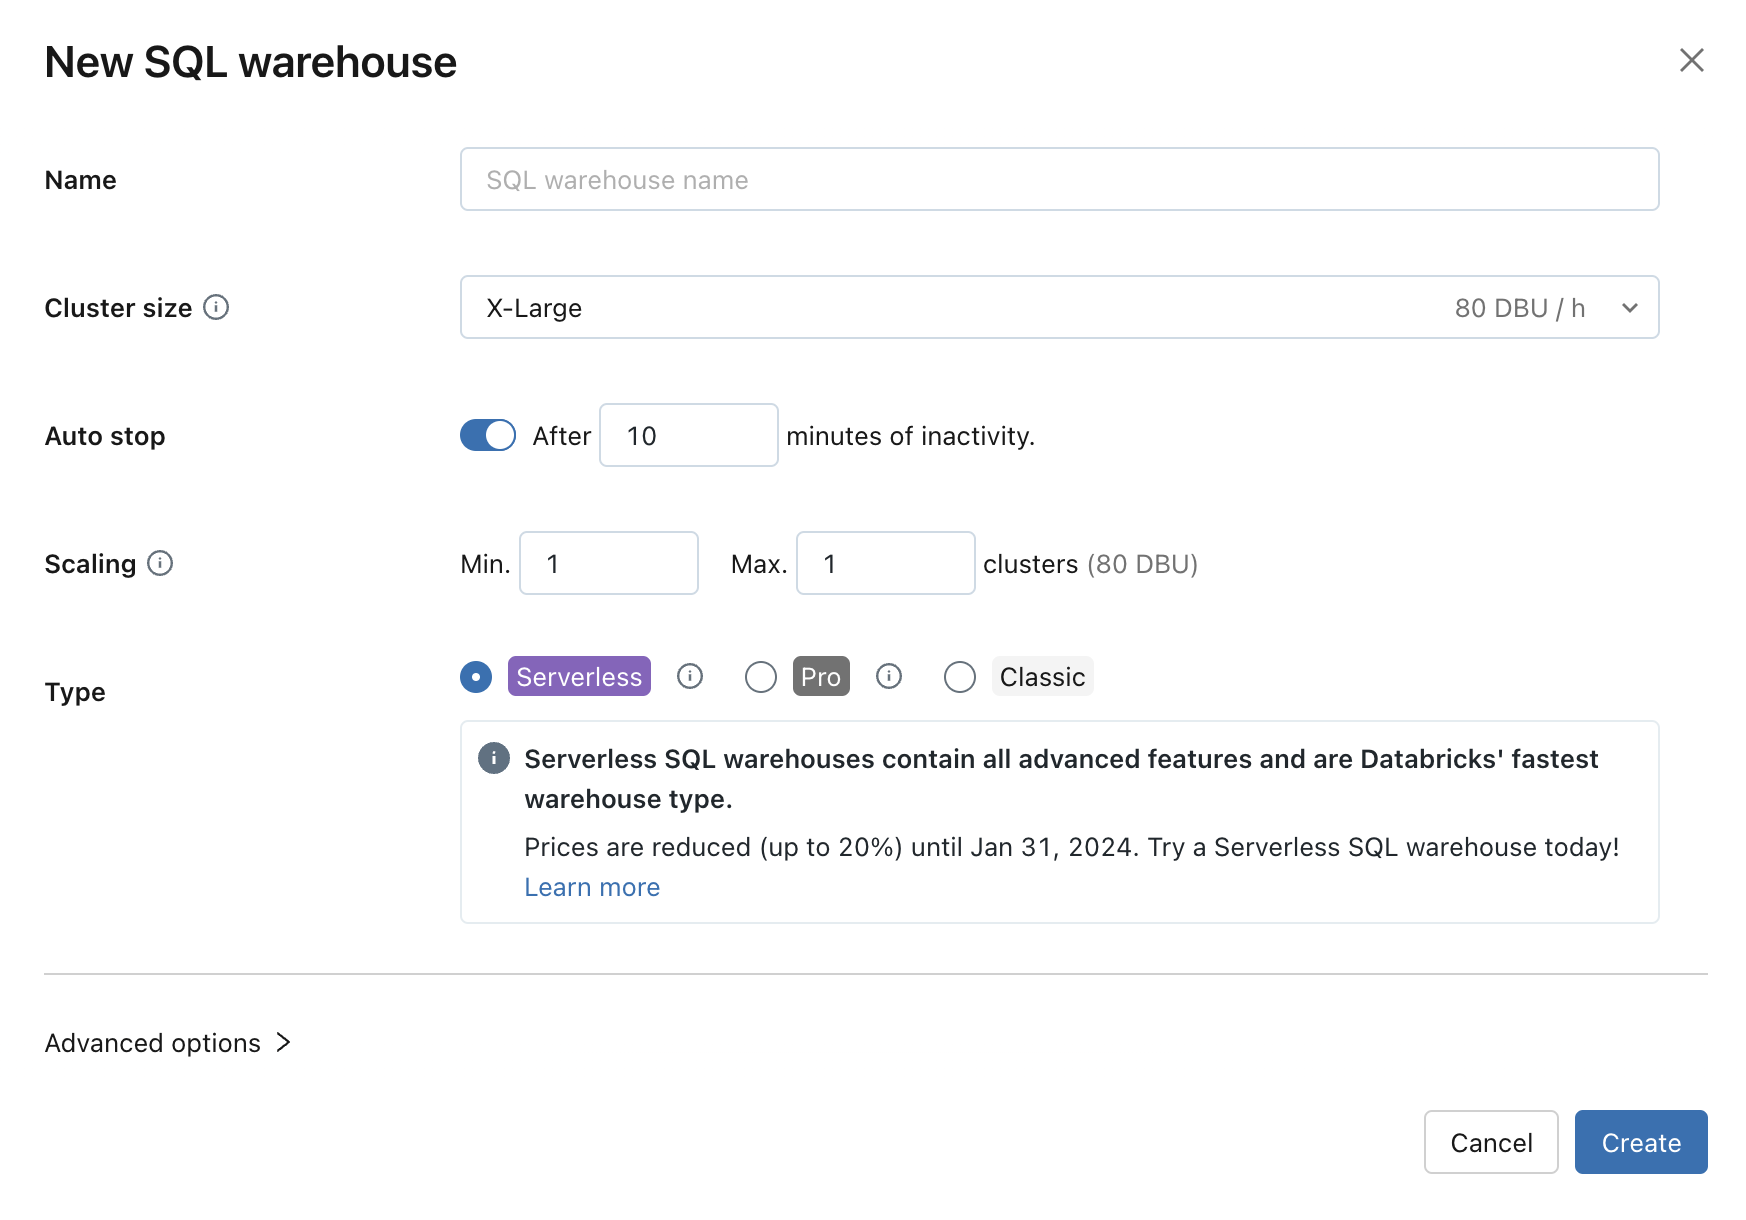
You can modify the following settings while creating or editing a SQL warehouse:
Cluster Size represents the size of the driver node and number of worker nodes associated with the cluster. The default is X-Large. To reduce query latency, increase the size.
Auto Stop determines whether the warehouse stops if it’s idle for the specified number of minutes. Idle SQL warehouses continue to accumulate DBU and cloud instance charges until they are stopped.
Pro and classic SQL warehouses: The default is 45 minutes, which is recommended for typical use. The minimum is 10 minutes.
Serverless SQL warehouses: The default is 10 minutes, which is recommended for typical use. The minimum is 5 minutes when you use the UI. Note that you can create a serverless SQL warehouse using the SQL warehouses API, in which case you can set the Auto Stop value as low as 1 minute.
Scaling sets the minimum and maximum number of clusters that will be used for a query. The default is a minimum and a maximum of one cluster. You can increase the maximum clusters if you want to handle more concurrent users for a given query. Databricks recommends a cluster for every 10 concurrent queries.
To maintain optimal performance, Databricks periodically recycles clusters. During a recycle period, you may temporarily see a cluster count that exceeds the maximum as Databricks transitions new workloads to the new cluster and waits to recycle the old cluster until all open workloads have completed.
Type determines the type of warehouse. If serverless is enabled in your account, serverless is the default. See SQL warehouse types for the list.
Advanced options
Configure the following advanced options by expanding the Advanced options area when you create a new SQL warehouse or edit an existing SQL warehouse. You can also configure these options using the SQL Warehouse API.
Tags: Tags allow you to monitor the cost of cloud resources used by users and groups in your organization. You specify tags as key-value pairs.
Unity Catalog: If Unity Catalog is enabled for the workspace, it is the default for all new warehouses in the workspace. If Unity Catalog is not enabled for your workspace, you do not see this option. See What is Unity Catalog?.
Channel: Use the Preview channel to test new functionality, including your queries and dashboards, before it becomes the Databricks SQL standard.
The release notes list what’s in the latest preview version.
Important
Databricks recommends against using a preview version for production workloads. Because only workspace admins can view a warehouse’s properties, including its channel, consider indicating that a Databricks SQL warehouse uses a preview version in that warehouse’s name to prevent users from using it for production workloads.
Manage a SQL warehouse
Workspace admins and uses with CAN MANAGE privileges on a SQL warehouse can complete the following tasks on an existing SQL warehouse:
To stop a running warehouse, click the stop icon next to the warehouse.
To start a stopped warehouse, click the start icon next to the warehouse.
To edit a warehouse, click the kebab menu
 then click Edit.
To add and edit permissions, click the kebab menu
then click Permissions.Assign Can use to users who need to run queries on the warehouse.
Assign Can monitor to power users for troubleshooting and optimizing query performance. Can monitor permission allows users to monitor SQL Warehouses, including query history and query profiles. This feature is in Public Preview.
Assign Can manage to users responsible for SQL warehouse sizing and spend limits decisions.
Is owner automatically applies to the SQL warehouse’s creator.
To learn about permission levels, see SQL warehouse ACLs.
To upgrade a SQL warehouse to serverless, click the kebab menu
, then click Upgrade to Serverless.To delete a warehouse, click the kebab menu
, then click Delete.
Note
Contact your Databricks representative to restore a deleted warehouses within 14 days.