AI/BI release notes
This article lists new features and updates for the AI/BI product line. AI/BI is a business intelligence product that includes dashboards for visualization and reporting, plus Genie for conversational analytics.
Release process
Databricks releases updates to AI/BI products on an ongoing basis. All users get the same updates, rolled out over a short period of time.
Note
Releases are staged. Your Databricks account might not be updated with a new feature until a week or more after the initial release date.
February 2025
The following features and updates were released in February 2025.
February 13, 2025
AI/BI dashboards
Fixed dashboards listing page: An issue that caused some dashboards to be excluded from the listing page has been resolved. The listing page now shows all dashboards that you have permission to access.
AI/BI Genie
Improved reasoning about generated SQL: Genie’s model for translating text into SQL now uses Chain-of-Thought reasoning to break down questions into manageable steps: first, identifying useful columns; next, planning the SQL generation; and finally, combining the parts into a single SQL query. This upgrade results in more robust and accurate SQL translations. You should see improvements in Genie’s ability to pick precise filter conditions and improved reasoning on nuanced questions.
Fixed progress indication: Resolved an issue where Genie was showing a Still thinking status after a result had already been returned.
Sharing a Genie space now sends an email notification to the recipient. See Share a Genie space.
Visualizations
Fixed zoom behavior:
Resolved an issue where zooming in on a chart altered the colors associated with quantitative values.
Resolved an issue that prevented zooming in on categorical charts with temporal fields.
Improved chart migration: Visualizations created in the SQL editor, legacy dashboards, and notebooks that do not include sorting now migrate as expected.
February 6, 2025
AI/BI dashboards
Customize sort order and label angles: Control the sorting order of data on the axis and adjust the angle of labels in visualizations. See Format axis settings.
Custom column widths for tables: All column types in table visualizations now support custom widths. Drag the handle at the top of a column to adjust its size.
Enhanced value display in stacked bar and pie charts: Stacked bar charts and pie charts now display raw values and percentages together.
Clone dashboard pages: You can now duplicate dashboard pages. See Clone a page.
Updated timezone handling: Visualizations now use the timezone from the dataset or compute resource instead of the browser settings. If a dataset includes two columns with different time zones, the second will be formatted to match the first.
AI/BI Genie
Hide visualizations in the chat window: Visualizations include a
 collapse icon in the upper-right corner that you can use to hide a chart. Click Show visualization to expand. To learn more about working with visualizations in Genie, see Generate visualizations.
January 2025
The following features and updates were released in January 2025.
January 30, 2025
AI/BI dashboards
Create calculated measures: Perform calculations and visualize new data fields without modifying the SQL queries that define a dataset. For details, see What are calculated measures?.
Sort dashboards by name: You can now sort dashboards by name on the dashboard listing page.
Expanded data display in charts: Dashboard visualizations now support up to 15,000 rows of data.
AI/BI Genie
Genie-generated visualizations: When Genie detects that a visualization would improve response clarity, it includes one with the result.
Improved warehouse status visibility: Genie now displays a Waiting for warehouse message when a request is queued and awaiting processing by the associated SQL warehouse.
Updated warehouse picker UI: The warehouse picker in Genie spaces now automatically selects the first running warehouse from the list. Its updated appearance matches other compute selectors in the Databricks UI.
Fixed results table issue: Genie now reliably includes table results in responses.
January 23, 2025
AI/BI dashboards
Publish using a service principal: You can now use the REST API to publish dashboards with service principal credentials. See Use a service principal to publish and share dashboards.
Reorder datasets: Drag and drop dataset names to change their order in the Data tab.
Cross-filtering support for point maps: Cross-filtering is now available for point map charts. For a list of chart types that support cross-filtering, see Cross-filtering.
New scatter chart scaling options: A Log (Symmetric) scale function is now available for scatter charts.
Fixed range sliders: The Range slider filter now correctly limits items to those within the selected range.
Fixed tooltips: Tooltips now display accurate totals for charts with labels.
AI/BI Genie
Fixed table identifier quoting: Genie now properly quotes table name identifiers in queries by adding backticks around each part of the catalog, schema, and table name. For example,
catalog.schema.tableis now formatted as`catalog`.`schema`.`table`to preventTABLE_OR_VIEW_NOT_FOUNDerrors.Fixed ANY keyword error: Genie now replaces the
ANYkeyword with theINkeyword when querying list columns to avoid common SQL errors.Improved query descriptions: Genie now uses an updated model to generate more precise and accurate query descriptions.
January 16, 2025
AI/BI dashboards
Download as PDF: You can now download a PDF copy of a published dashboard. See Download a published dashboard.
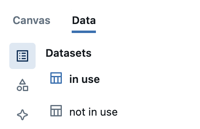
Visually identify datasets in use: A visual indicator now marks whether datasets in the data tab are used in visualizations on the canvas. Datasets that support canvas widgets have a blue icon and a bolded title. Unused datasets have a grey icon and a non-bolded title.
Generate new charts with Databricks Assistant: Databricks Assistant now supports creating dual-axis charts from natural language requests.
COUNT(*)added as a measure: When choosing fields from the visualization editor,COUNT(*)is now in the measure section.Fix: Hover lines now appear correctly on horizontal charts.
Fix: Downloading datasets as Excel files now preserves the correct numeric data types.
Release note history
To access older release notes, see AI/BI release note history.