Dashboards
You can use dashboards to build data visualizations and share reports with your team. AI/BI dashboards feature AI-assisted authoring, an enhanced visualization library, and a streamlined configuration experience so that you can quickly transform data into sharable insights. When published, your dashboards can be shared with anyone registered to your Databricks account, even if they don’t have access to the workspace. See Share a dashboard.
Important
Databricks recommends using AI/BI dashboards (formerly Lakeview dashboards). Earlier versions of dashboards, previously referred to as Databricks SQL dashboards are now called legacy dashboards. Databricks does not recommend creating new legacy dashboards.
Convert legacy dashboards using the migration tool or REST API. See Clone a legacy dashboard to an AI/BI dashboard for instructions on using the built-in migration tool. See Dashboard tutorials for tutorials on creating and managing dashboards using the REST API.
AI/BI dashboards have the following components:
Data: The Data tab allows users to define datasets for use in the dashboard. Datasets are bundled with dashboards when sharing, importing, or exporting them using the UI or API.
Canvas: The Canvas tab can be organized into multi-page reports. Dashboard editors can build and configure their dashboards by adding widgets such as visualizations, filters, text, and images.
Note
You can define up to 100 datasets per dashboard. The Canvas can contain up to 10 pages. Dashboards can hold up to 100 widgets across all pages.
View and organize dashboards
You can access dashboards from the workspace browser along with other Databricks objects.
Click
 Workspace in the sidebar to view dashboards from the workspace browser. Dashboards are stored in the
 /Workspace/Users/<username>directory by default. Users can organize dashboards into folders in the workspace browser along with other Databricks objects. See Workspace browser.To view the dashboard listing page, click
 Dashboards in the sidebar.
By default, the dashboard listing page shows dashboards that you have access to sorted in reverse chronological order. You can filter the list by entering a title into the search bar, filter by last modified within a time period, or filter by owner.
Click a dashboard title to open it. If the dashboard has been published before, the published version opens. Otherwise, the draft dashboard opens.
Create a new dashboard
To create a new dashboard from the dashboard listing page, click Create near the upper-right corner of the page.
Draft and collaborate on a dashboard
New dashboards begin as a draft. You can share the draft with other users in your workspace to collaborate. You cannot share draft dashboards with users outside of the workspace. All users use their credentials to interact with the data and visualizations in dashboard drafts.
For more information about permission levels, see AI/BI dashboard ACLs.
Define your datasets
Use the Data tab to define the underlying datasets for your dashboard.
You can define datasets as any of the following:
A new query against one or more tables or views.
An existing Unity Catalog table or view.
Note
All datasets are defined by a query. When you choose an existing Unity Catalog table or view, the query for that dataset is a SELECT * statement on that table or view. You can modify the query to refine the dataset.
You can define datasets using any type of table or view. You can define multiple datasets by writing additional queries or selecting additional tables or views. To format a query, right-click in the editor and then click Format document.
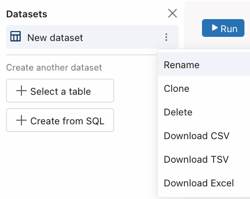
After defining a dataset, you can use the  kebab menu to the right of the dataset name to rename, clone, or delete it. You can also download the dataset as a CSV, TSV, or Excel file.
View the results table
When you create a dataset, the query runs automatically, and the results appear as a table in the pane below the editor. Each column includes an icon indicating its data type.
To sort column values:
Hover over each column to show the
 sort icon.
Click the icon to sort the values in ascending or decending order.
View the query result schema
To view the schema of your defined dataset, click Schema to the right of Result Table. The Schema tab lists all fields from the defined dataset. Each field is labeled with an icon denoting the column’s datatype. If the underlying tables or views include comments, they appear in the Schema tab.
Write multi-statement queries
In some cases, you might want to construct a dataset using multiple SQL statements. To run multiple statements, end each statement with a semicolon (;). When you run those commands to create the dataset, the output shows the results of the last statement in the editor. This dataset is used for any related visualizations on the canvas.
Statements are local to the dataset in which they are issued. For example, if you create a dataset with a USE statement to set the catalog or schema, that setting applies only to that dataset.
Examples
The following examples demonstrate common uses for multi-statement queries.
Set the catalog and schema
You can write a USE statement to declare the catalog and schema for the table in your query. The following query contains three statements. The first sets the catalog name. The second sets the schema. The SELECT statement references only the table name because the catalog and schema have been set. See USE CATALOG.
USE CATALOG samples;
USE SCHEMA tpch;
SELECT * FROM customer;
Set ANSI mode
You can set a query to run with ANSI_MODE set to TRUE or FALSE. For Databricks SQL, the system default value for ANSI_MODE is TRUE. See ANSI_MODE.
The following query sets ANSI_MODE to FALSE so that invalid data type inputs return NULL instead of throwing an error.
SET ANSI_MODE = FALSE;
SELECT cast('a' AS INTEGER);
Parameterize complex queries
You can use multiple statements to parameterize the view name for a common table expression or other complex query.
The following query creates two temporary views. The SELECT statement uses the IDENTIFIER clause to interpret the input string as a table name. See IDENTIFIER clause.
CREATE TEMPORARY VIEW v1 AS SELECT 1;
CREATE TEMPORARY VIEW v2 AS SELECT 2;
SELECT * FROM IDENTIFIER(:view_name)
Set variables
The following query declares a variable and value in the first statement. The second statement changes the value of the variable. The third statement shows the end value for the variable is 5. See SET VARIABLE for details and complete syntax for using temporary variables.
DECLARE VARIABLE myvar1 INT DEFAULT 7;
SET VAR myvar1 = 5;
VALUES (myvar1);
Limit data access with SQL
All the data in a dashboard dataset can be accessible to dashboard viewers, even if it’s not displayed in a visualization. To prevent sensitive data from being sent to the browser, limit the columns specified in the SQL query that defines the dataset. For example, rather than selecting all columns from a table, choose only the specific columns needed for the visualizations in your SQL statement rather than table configuration.
Add pages, visualizations, text, and filters to the canvas
Use the Canvas tab to construct your dashboard. A canvas can contain up to ten pages. You can add visualizations, text, and filter widgets to each page. Use multiple pages to organize your content presentation, minimize scrolling, and improve dashboard readability. Use the toolbar at the bottom of each page to add widgets such as visualizations, text boxes, and filters.
Create multi-page reports
New dashboards start with a single page named Untitled page. To edit the name of a page, double-click the title and enter the new name into the text field. Naming conflicts resolve automatically by appending a number to the title.
To view the content on a page, click the title to select it.
Add and remove pages
To add a new page:
Click
 to the right of the current page title on the canvas. By default, your new page is named Untitled page.
(Optional) Double-click the page title and enter a new name to rename the page.
To remove a page:
Click the
kebab menu to the right of the page title.Click Delete to delete the page.
Note
Deleting a page also deletes all of the widgets on that page. If you delete all pages, click Create a page to start building your dashboard again.
Visualizations
Create a visualization by adding a visualization widget to a page on the canvas. Supported visualizations include area, bar, box, combo, counter, heatmap, histogram, line, pie, pivot, scatter, and table chart types. For a complete list of available visualization types and example configuration values, see Dashboard visualizations types.
Note
Queries used by visualizations do not always correspond precisely to the dataset. For example, if you apply aggregations to a visualization, the visualization shows the aggregated values.
To create a visualization, use one of the following methods:
AI-assisted visualizations: Describe the chart you want to see in natural language and let Databricks Assistant generate a chart. After it is created, you can modify the generated chart using the configuration panel. You cannot use Assistant to create table or pivot table chart types.
Use the configuration panel: Apply additional aggregations or time bins in the visualization configuration without modifying the dataset directly. You can choose a dataset, x-axis values, y-axis values, and colors.
For details about how to apply custom formatting to your charts, see Dashboard visualizations. See Table options to learn how to control data presentation in table visualizations.
Note
When you apply temporal transformations in the visualization configuration, the date shown in the visualization represents the start of that period.
Text widgets
Markdown is a markup language for formatting text in a plain text editor. You can use markdown in text widgets to format text, insert links, and add images to your dashboard.
Add images to text widgets
Use one of the following methods to add images to your dashboard. Each method includes sample markdown syntax that edit to display your image. To resize an image, adjust the widget dimensions.
Use a local file:
To display a local file, first encode it as a base64 string. Then, use the following markdown syntax, replacing
<base64-encoded-string>with your encoded string.
Note
If you’re comfortable with command-line utilities, use the
base64tool to convert your file. Alternatively, there are many free online resources that you can use to base64 encode files.From a volume:
<WorkspaceURL>/ajax-api/2.0/fs/files/<Volumes/path/to/image>
Replace the sample text in this example with your workspace URL and the path to the image stored in a volume.
Use the following steps to get the path to your image:
Click
 Catalog in the sidebar to open the Catalog Explorer UI.
Click the image file in the schema browser.
Click the
kebab menu to the right of the file name. Then, click Copy Path.
See What are Unity Catalog volumes? to learn more about storing data in volumes.
Publically hosted images:
For publicly hosted images, use the following markdown syntax and insert the public URL that points to the image.

Replace the sample text with the description and URL of the image you want to show. For example, the following markdown will insert an image of the Databricks logo: .
For more information on markdown syntax, see this guide.
Note
When you publish your dashboard with embedded credentials, viewers use your credentials to access the included images. If your dashboard is not published with embedded credentials, you must explicitly grant access to users for image files stored on Databricks. Use Catalog Explorer to check, grant, and revoke permissions on the image files that you want to include. Click ![]() Catalog in the sidebar to open the Catalog Explorer UI.
Catalog in the sidebar to open the Catalog Explorer UI.
Cross-filtering
Cross-filtering allows users to inspect a selected subset of data and interactively explore relationships and patterns across multiple visualizations. When a dashboard viewer clicks an element in one chart, all other charts based on the same dataset are automatically filtered on that value.
As a dashboard editor, set up cross-filtering by creating two or more charts that share the same dataset. The following chart types let viewers filter the dataset by clicking a chart element:
Bar
Box plot
Heatmap
Histogram
Pie
Scatter
After selection, all other visualizations based on the same dataset are automatically updated with filtered values.
Use filters
Filters are dashboard widgets that help viewers narrow down results and refine data in visualizations, similar to slicers in other BI tools. You can configure them to filter values based on one or more dataset columns (also referred to as fields) or parameters defined in the SQL queries that create datasets. To learn how to configure filters for visualizations on a dashboard, see Use dashboard filters.
Copy widgets
Use keyboard shortcuts to copy a selected widget and paste it back on the canvas. After you create a new widget, you can edit it as you would any other widget.
To clone a widget on your draft dashboard canvas, complete the following steps:
Right-click on a widget.
Click Clone.
A clone of your widget appears below the original.
Remove widgets
Delete widgets by selecting a widget and pressing the delete key on your keyboard. Or, right-click on the widget. Then, click Delete.
Download results
You can download datasets as CSV, TSV, or Excel files. You can download visualizations on the canvas as PNG files.
To open download options from the Canvas tab, click the
kebab menu in the upper-right corner of the widget.To open download options from a Data tab, click the
kebab menu to the right of the dataset.
You can download up to approximately 1GB of results data in CSV and TSV format and up to 100,000 rows to an Excel file. The final file download size might be slightly more or less than 1GB, as the 1GB limit is applied to an earlier step than the final file download.
To learn how to download a published dashboard as a PDF, see Download a published dashboard.
Publish a dashboard
Publish a dashboard to create a clean copy of the current draft. You must have at least CAN EDIT permissions to publish a dashboard.
After you publish a dashboard, the published version remains intact until you publish again, even if you make changes to the draft. You can make modifications and improvements to the draft version without affecting the published copy. Any registered user with access to the published dashboard can continue to view the published version. The published version continues to be emailed to subscribers if any exist. For more on managing dashboard access, see Share a dashboard.
Important
Published dashboards are not versioned and should not be used for version control. You cannot revert a draft dashboard back to a previously published state.
When publishing, choose one of the following:
Embed credentials: All viewers of a published dashboard can run queries using your credentials for data and compute resources. This allows registered users with dashboard access to view it, even if they lack access to the originating workspace, underlying data, or SQL warehouse. This might expose data to users who have not been granted direct access to it. This is the default option.
Don’t embed credentials: All viewers of the published dashboard run queries using their own data and compute credentials. To view results in the dashboard, viewers need access to the workspace, the attached SQL warehouse, and the associated data.
Note
All dashboard viewers must authenticate to access the dashboard, regardless of the credential setting.
See Share a published dashboard for recommendations on which setting to choose.
To publish a dashboard, complete the following steps:
Open a dashboard. If the dashboard has been published previously, the published version opens. If necessary, use the switcher at the top of the page to see the current draft version.
Click Publish. The Publish dialog appears.
Choose the credentials to use for the published dashboard. You can choose to embed your credentials or not.
Click Publish. If your dashboard is being published for the first time, a Sharing dialog opens and prompts you to share the published dashboard. See Share a dashboard for details and recommendations on sharing.
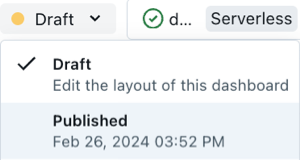
To access the published dashboard, click Published in the drop-down menu near the top of the dashboard.
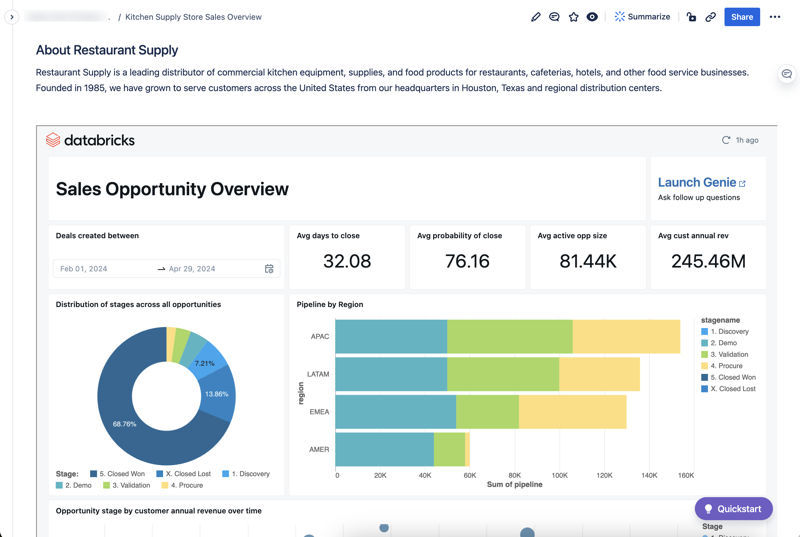
Enable a Genie space from your dashboard
Preview
This feature is in Public Preview.
When you create a dashboard, a Genie space is automatically created for you. A Genie space is a no-code interface that allows business users to conduct self-serve data analytics using natural language. The automatically created Genie space starts as a draft that you can use to preview the space. The draft Genie space stays in sync with your draft dashboard as you add and remove datasets and visualizations.
When you publish your dashboard, you can choose to publish the associated draft Genie space or link to an existing Genie space instead.
Publishing a Genie space associated with your dashboard allows viewers to explore dashboard data in a different way. Instead of gaining insights based only on what’s available on a dashboard, they engage with the data by asking their own questions for deeper analysis. See What is an AI/BI Genie space.
Publishing the Genie space adds an Ask Genie button to the published dashboard. When dashboard viewers click on that button, a chat interface opens on the dashboard and prompts users to ask questions about the data.
To publish the associated Genie space, use the following steps:
Click Publish.
The Enable Genie toggle is on by default. Click the toggle to turn it on.
(Optional) To link an existing Genie space, select the Link existing Genie space radio button and paste in the associated URL. If this option is not selected, a new Genie space is based on your dashboard is automatically generated for you.
Click Publish in the Publish dialog.
Note
The draft and published Genie spaces are independent, much like the draft and published versions of your dashboard. Any changes made to the draft dashboard are reflected in the published Genie space only when the dashboard is republished. Draft and published Genie spaces are companions to your dashboard. They do not appear in your file browser or the Genie listing page.
To open the published Genie space in a new window:
Click the
kebab menu in the upper-right corner of the chat windowClick Open Genie Space.
To preview your draft Genie space:
Click the
kebab menu in the upper-right corner of your dashboard.Click Open the draft Genie space.
Note
You cannot edit the instructions for this Genie space from the Genie space UI. Your draft Genie space only changes when you make changes to the draft dashboard.
Permissions for linked Genie spaces
Permissions on the associated Genie space mirror those in place on the dashboard, but access is limited to users with workspace access. Even if your dashboard is shared with embedded credentials, only users with workspace access can interact with the Genie space.
Viewers use their own credentials to access the compute and data necessary to power the Genie space. They must have at least SELECT permission on the tables used in the Genie space.
Embed dashboards in websites and applications
You can embed your published dashboard into external websites and applications using an iframe. See Embed a dashboard.
If you are a workspace admin who wants to manage the external sites where dashboards can be embedded, see Manage dashboard embedding.
Schedules and subscriptions
You can set up scheduled updates to automatically refresh your dashboard’s cache and optionally send emails with a PDF of the latest dashboard to users who are subscribed to the schedule. Users with at least Can Edit permissions can create a schedule so that published dashboards with embedded credentials run periodically. Each dashboard can have up to ten schedules.
Export, import, or replace a dashboard
You can export and import dashboards as files to facilitate the sharing of editable dashboards across different workspaces. To transfer a dashboard to a different workspace, export it as a file and then import it into the new workspace. You can also replace dashboard files in place. That means that when you edit a dashboard file directly, you can upload that file to the original workspace and overwrite the existing file while maintaining existing sharing settings.
The following sections explain how to export and import dashboards in the UI. You can also use the Databricks API to import and export dashboards programmatically. See POST /api/2.0/workspace/import.
Export a dashboard file
From a draft dashboard, click the
kebab menu at the screen’s upper-right corner, then click Export dashboard.Confirm or cancel the action using the Export dashboard dialog. When the export succeeds, a
.lvdash.jsonfile is saved to your web browser’s default download directory.
Import a dashboard file
From the dashboards listing page, click
 > Import dashboard from file.
Click Choose file to open your local file dialog, then select the
.lvdash.jsonfile you want to import.Click Import dashboard to confirm and create the dashboard.
The imported dashboard is saved to your user folder. If an imported dashboard with the same name already exists in that location, the conflict is automatically resolved by appending a number in parentheses to create a unique name.
Best practice for managing dashboard versions
To enable collaboration and manage different versions of a dashboard, Databricks recommends using the following steps:
Export your dashboard as a JSON file. The file format is
lvdash.json.Add that file to a version control system, such as Git.
Edit the file. Dashboard files include complete query syntax and widget settings. You can edit values in the text file directly or upload it back to your workspace and make changes in the UI.
Save the new file. If you’ve made changes in the UI, export your new file. Use your version control system to track dashboard changes and versions.
Update the existing dashboard. From the existing draft dashboard:
Click the
kebab menu in the upper-right corner and then click Replace dashboard.Click Choose file in the Replace dashboard from file dialog. Then, click Overwrite.
Managing dashboards with the REST API
See Use Databricks APIs to manage dashboards for tutorials that demonstrate how to use Databricks REST APIs to manage dashboards. The included tutorials explain how to convert legacy dashboards into Lakeview dashboards, as well as how to create, manage, and share them.
To learn how to manage an AI/BI dashboard using Databricks Asset Bundles (DABs), see dashboard.
Databricks also offers a Terraform provider. See the Databricks Terraform documentation.