AI/BI dashboard filters
Filters allow dashboard viewers to interact with a dashboard and dynamically adjust the data displayed according to their needs. This article outlines the types of filters that you can configure on an AI/BI dashboard and has example configurations for filters.
Filter widgets
Anyone with CAN EDIT permissions or above can add filters to a draft dashboard canvas. Filter widgets allow dashboard viewers to interact with dashboard data. After you create a filter, you can configure it to filter on a particular field or correspond to a defined parameter. A single filter widget can be applied to:
Fields in one or more datasets
Parameters in one or more datasets
A combination of fields and parameters to generate a query-based dropdown list. See What are dashboard parameters? and Use query-based parameters.
Filter types
When a filter widget is selected on the dashboard, a configuration panel appears on the right. You can use this panel to choose the filter type, decide whether to include a title or description and specify the data to be filtered. You can apply filters to one or more datasets. The following examples show the types of filters you can use and the configuration settings for each filter.
See Dashboard visualization types for an explanation of visualization configuration settings.
Multiple values
A multiple value filter creates a drop-down list of all possible values in a field. Dashboard viewers can select one or more filter values to apply to the visualization. When the viewer makes a filter selection, the chart updates with filtered values.
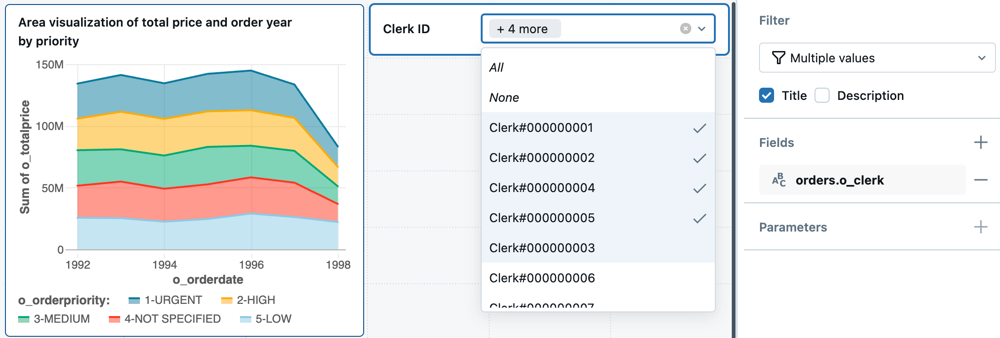
Configuration details:
Filter type: Multiple values
Title: Clerk ID
Fields: orders.o_clerk
Single value
A single value filter creates a drop-down list of all possible values in a field. Dashboard viewers can choose a filter value to apply to a visualization. The chart changes dynamically when the viewer selects a new value.
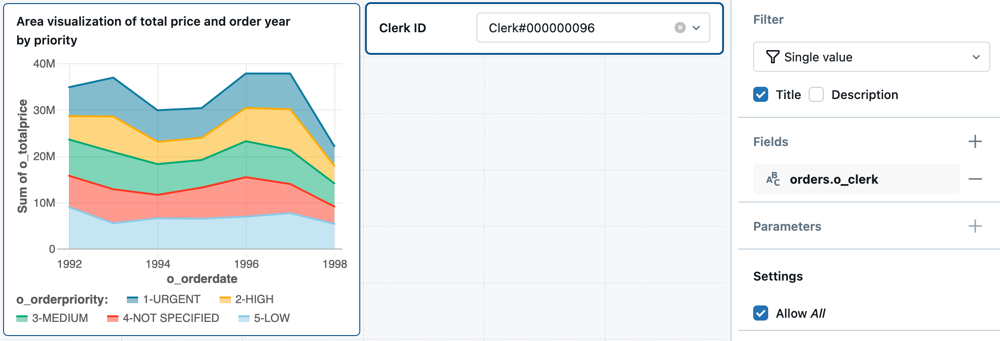
Configuration details:
Filter type: Single value
Title: Clerk ID
Fields: orders.o_clerk
Settings: Allow All
For single-value filters, Allow All automatically inserts All as an option in the drowdown, allowing viewers to filter for all data.
Date picker
A date picker filter allows dashboard viewers to focus dashboard widgets on a single day. They can type a date into the widget or select one from the calendar drop-down.
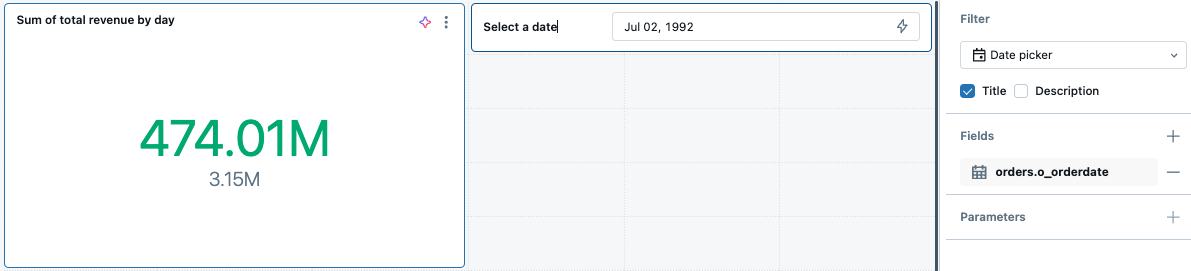
Configuration detais:
Filter type: Date picker
Title: Select date
Fields: orders.o_orderdate
Date range picker
A date range filter allows dashboard viewers to quickly select a date range, such as the last 24 hours or the last two weeks. Alternatively, you can select a custom date range by typing in a date or choosing a start point and end point from the calendar.
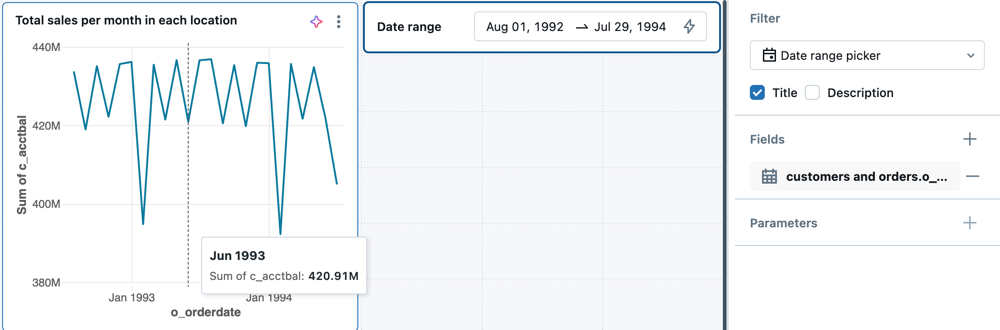
Configuration details:
Filter type: Date range picker
Title: Date range
Fields: customers and orders.o_orderdate
Text entry
A text entry filter allows dashboard viewers to type an entry into a filter widget and return records that match. You can set match mode to Contains, Exact match, or Starts with in the configuration panel. You can also choose whether the search term should be case senstiive.
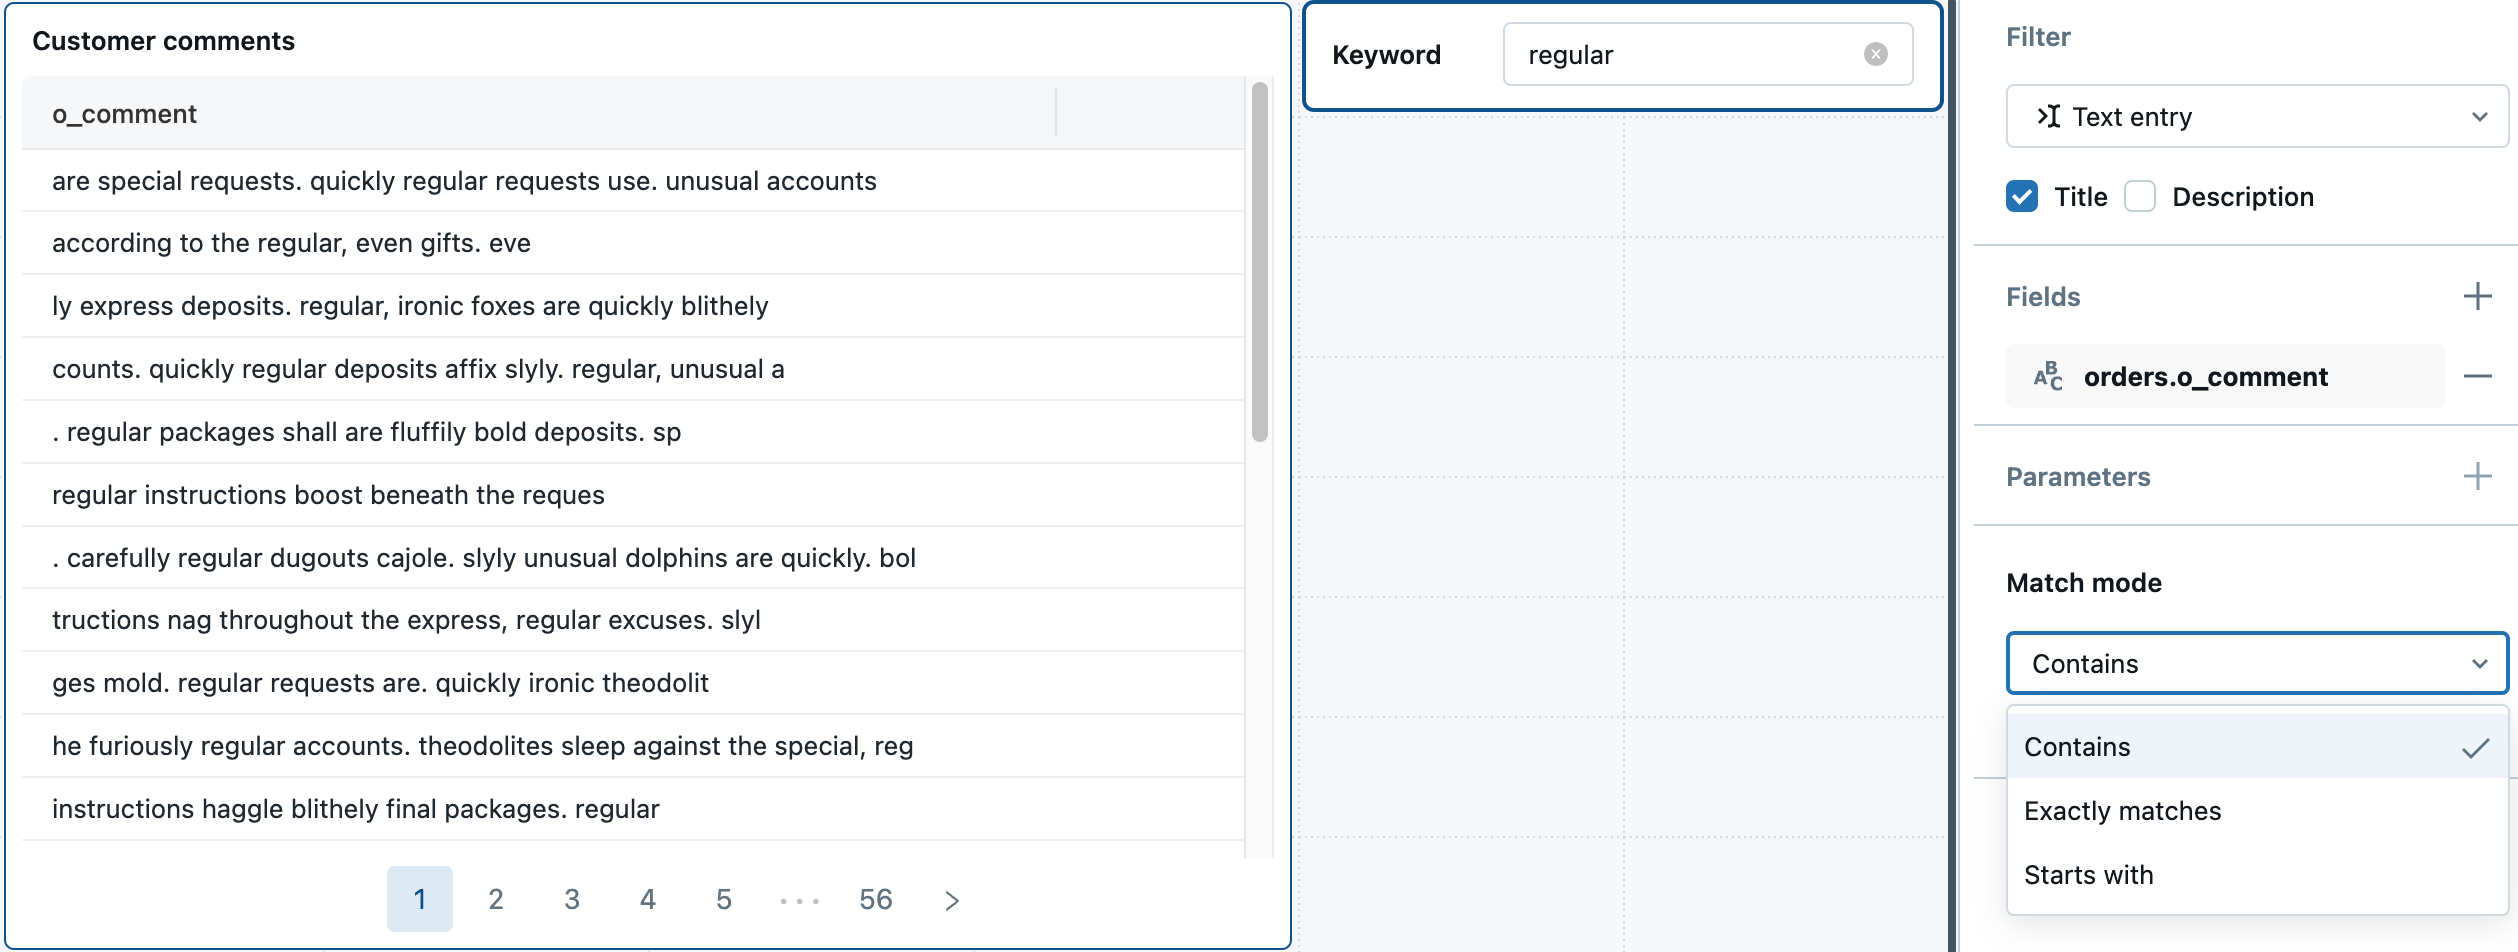
Configuration details:
Filter type: Text entry
Title: Keyword
Fields: orders.o_comment
Range slider
A range slider allows dashboard viewers to select a numeric range as a filter. When they use the slider to adjust the values, any visualizations associated with that dataset automatically update.
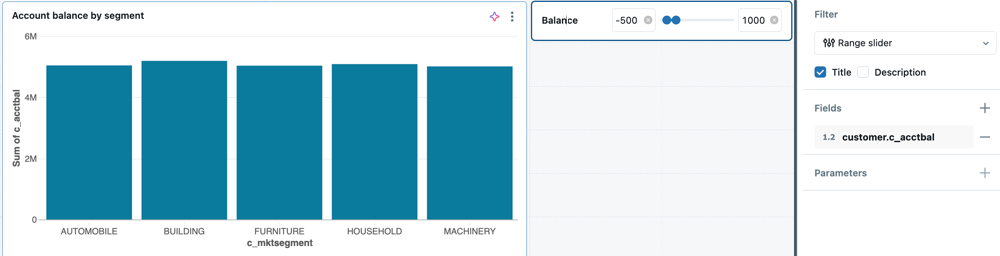
Configuration details:
Filter type: Range slider
Title: Balance
Fields: customers.c_acctbal