Work with dashboard parameters
This article explains how to use parameters on AI/BI dashboards. If you want to learn about field filters instead, see Filter on fields.
AI/BI dashboard parameters let you substitute different values into dataset queries at runtime. This allows you to filter data by criteria such as dates and product categories before data is aggregated in a SQL query, leading to more efficient querying and precise analysis. Parameters can be used with filter widgets to make dashboards interactive or with visualization widgets to make datasets easier to reuse.
Dashboard authors or editors add parameters to datasets and connect them to one or more widgets on the dashboard canvas. For static parameters set in visualization widgets, the values are set by the authors or editors. For parameters used in filter widgets, dashboard viewers can interact with the data by selecting values in filter widgets at runtime. This interaction reruns the associated queries and displays visualizations based on the filtered data.
Parameters directly modify the query, which can be powerful. Dataset field filters can also offer dashboard interactivity, more features, and better performance with large datasets than parameters. See Use filters.
Add a parameter to a query
You must have at least CAN EDIT permissions on the draft dashboard to add a parameter to a dashboard dataset. You can add parameters directly to the dataset queries in the Data tab.
To add a parameter to a query:
Place your cursor where you want to place the parameter in your query.
Click Add parameter to insert a new parameter.
This creates a new parameter with the default name
parameter. To change the default name, replace it in the query editor. You can also add parameters by typing this syntax in the query editor.
Edit a query parameter
To edit a parameter:
Click
 next to the parameter name. A Parameter details dialog appears and includes the following configuration options:
Keyword: The keyword that represents the parameter in the query. This can only be changed by directly updating the text in the query.
Display name: The name in the filter editor. By default, the title is the same as the keyword.
Type: Supported types include String, Date, Date and Time, Numeric.
The default type is String.
The Numeric datatype allows you to specify between Decimal and Integer. The default numeric type is Decimal.
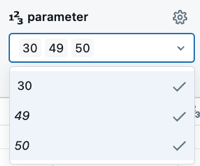
Allow multiple selections: Select the checkbox to allow users to choose multiple parameters at runtime.
Note
This selection might require an additional change to your query. See Allow multiple selections.
Click another part of the UI to close the dialog.
Set a default parameter value
For your query to run, choose a default value for your parameter by typing it into the text field under the parameter name. Run the query to preview the query results with the parameter value applied. Running the query also saves the default value. When you set this parameter using a filter widget on the canvas, the default value is used unless a new default value is specified in the filter widget. See Use filters.
Allow multiple selections
Queries that allow multiple selections must include an ARRAY_CONTAINS function in the query.
The following example shows a SQL query that allows you to select multiple values to insert into the query at runtime. The WHERE clause uses the ARRAY_CONTAINS function. That function takes the parameter keyword and the column name as arguments. When the query runs, it returns all rows containing the selected parameter values.
SELECT
  *
FROM
  samples.tpch.lineitem
WHERE array_contains(:parameter, l_quantity)
To set default values, type them into the text field under the display name. Select the current value before entering the next one.
Apply date range parameters
You can use parameters to define a range and return only results within that range. When you choose one of the following parameter types, you create two parameters that are designated by .min and .max suffixes:
Date Range
Date and Time Range
The following example shows a SQL query that creates a date range parameter named date_param.
SELECT * FROM samples.tpch.lineitem
WHERE l_shipdate BETWEEN :date_param.min and :date_param.max
To create a date range parameter:
Click Add parameter.
Click
next to the parameter name. Enter the Keyword and Display name. Do not include .minor.maxsuffixes.Choose Date Range or Date and Time Range as the Type.
Insert a
WHEREclause that defines the range into your query. To define the range, use aBETWEENclause with.minand.maxvalues. For example:WHERE date_col BETWEEN :date_param.min AND :date_param.max
Enter default date values and run the query to test it. Use the calendar icon to choose preset options like last week or last month.
Query-based parameters
Query-based parameters allow authors to define a dynamic or static list of values that viewers can choose from when setting parameters as they explore data in a dashboard. They are defined by combining a field filter and a parameter filter in a single filter widget.
To create a query-based parameter, the dashboard author performs the following steps:
Create a dataset whose result set is limited to a list of possible parameter values.
Create a dataset query that uses a parameter.
Configure a filter widget on the canvas that filters on a field and uses a parameter.
The Fields configurations should be set to use the field with the desired list of eligible parameter values.
The Parameters configuration should be set to select a parameter value.
Note
If a dataset used in query-based parameters is also used in other visualizations on a dashboard, a viewer’s filter selection modifies all connected queries. To avoid this, authors should create a dedicated dataset for query-based parameters that is not used in any other visualizations on the dashboard.
See Use query-based parameters for a step-by-step tutorial that demonstrates how to add a query-based parameter and visualization.
Create a dynamic parameter list
To create a dynamic dataset that populates the drop-down that viewers use to select parameter values, write a SQL query that returns a single field and includes all the values in that field. Any new value in that field is automatically added as a parameter selection. An example SQL query is as follows:
 SELECT
    DISTINCT c_mktsegment
  FROM
    samples.tpch.customer
Static widget parameters
Static widget parameters are configured directly in a visualization widget, allowing authors to individually parameterize visualization widgets that share the same dataset. This allows for the same dataset to present different views on the canvas.
The example in this section is based on a dataset that queries the samples.nyctaxi.trips table. The provided query returns the distance of each trip and categorizes the pickup day as either Weekday or Weekend. The query parameter filters for results based on whether the pickup occurred on a weekday or weekend.
The query text is provided in the following code block, but the instructions in this section are limited to setting up the associated visualizations configured with static widget parameters. For instructions on setting up a dataset with parameters, see Add a parameter to a query.
  WITH DayType AS (
    SELECT
      CASE
        WHEN DAYOFWEEK(tpep_pickup_datetime) IN (1, 7) THEN 'Weekend'
        ELSE 'Weekday'
      END AS day_type,
      trip_distance
    FROM samples.nyctaxi.trips
  )
  SELECT day_type, trip_distance
  FROM DayType
  WHERE day_type = :day_type_param
To add a static widget parameter to a visualization:
Add a visualization widget to the draft dashboard canvas.
With the new widget selected, choose the parameterized dataset from the Dataset drop-down in the configuration panel.
Click Show filters. For datasets that include parameters, a Parameters section appears in the configuration panel.
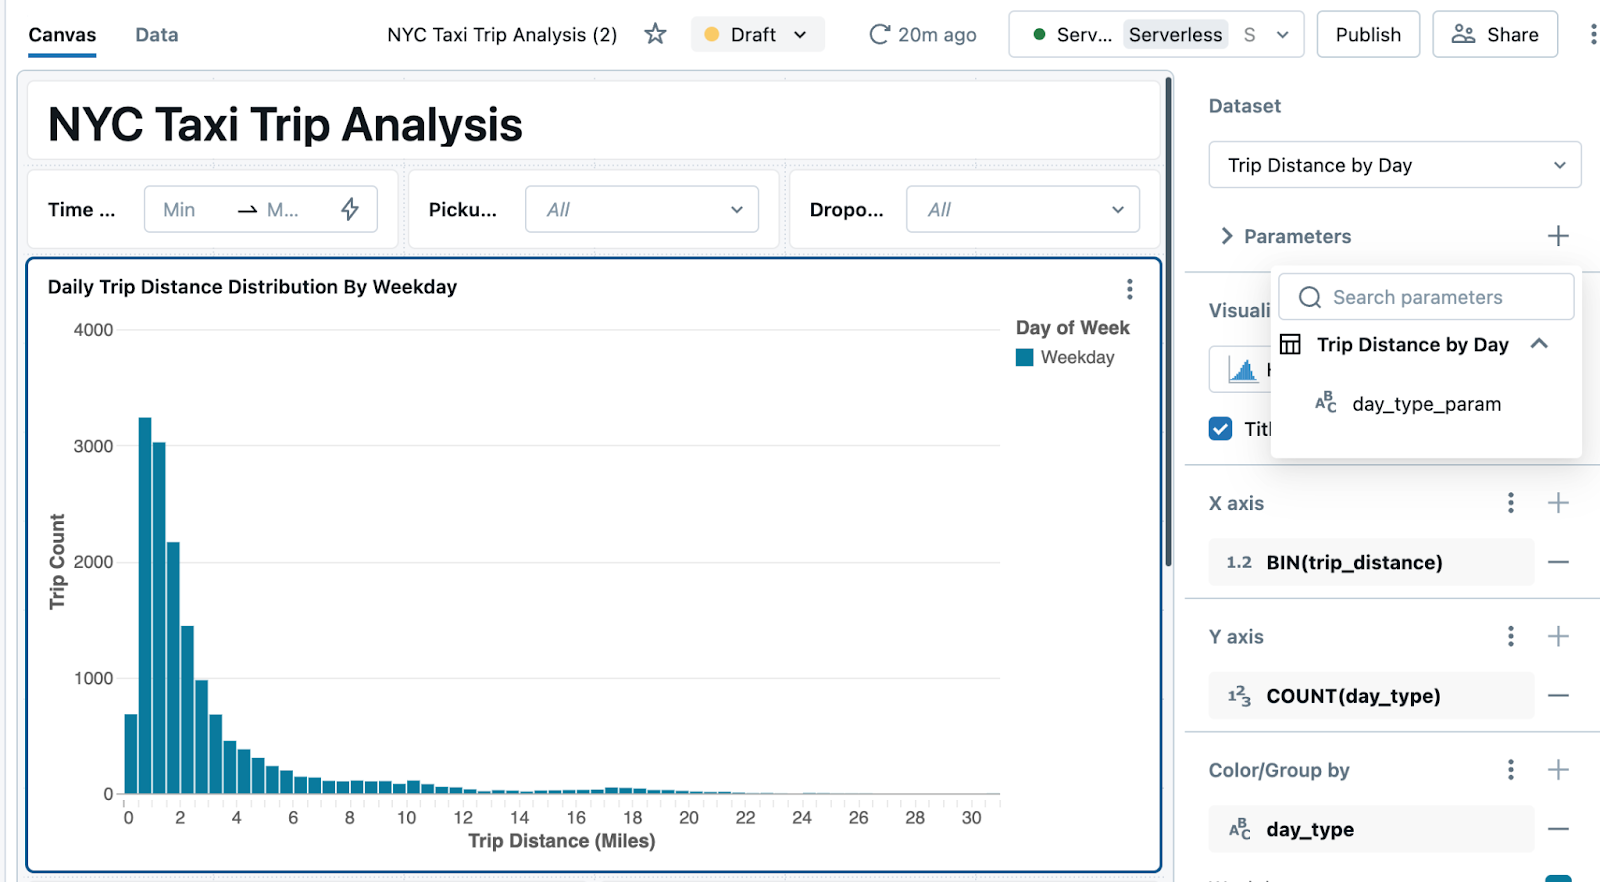
Click the plus sign to the right of the Parameters heading and choose a parameter from the drop-down.
By default, the parameter value mirrors what is set in the query on the Data tab. You can keep it or choose a new value to substitute into the dataset. Navigate away from the text field to show the visualization with the new parameter applied.
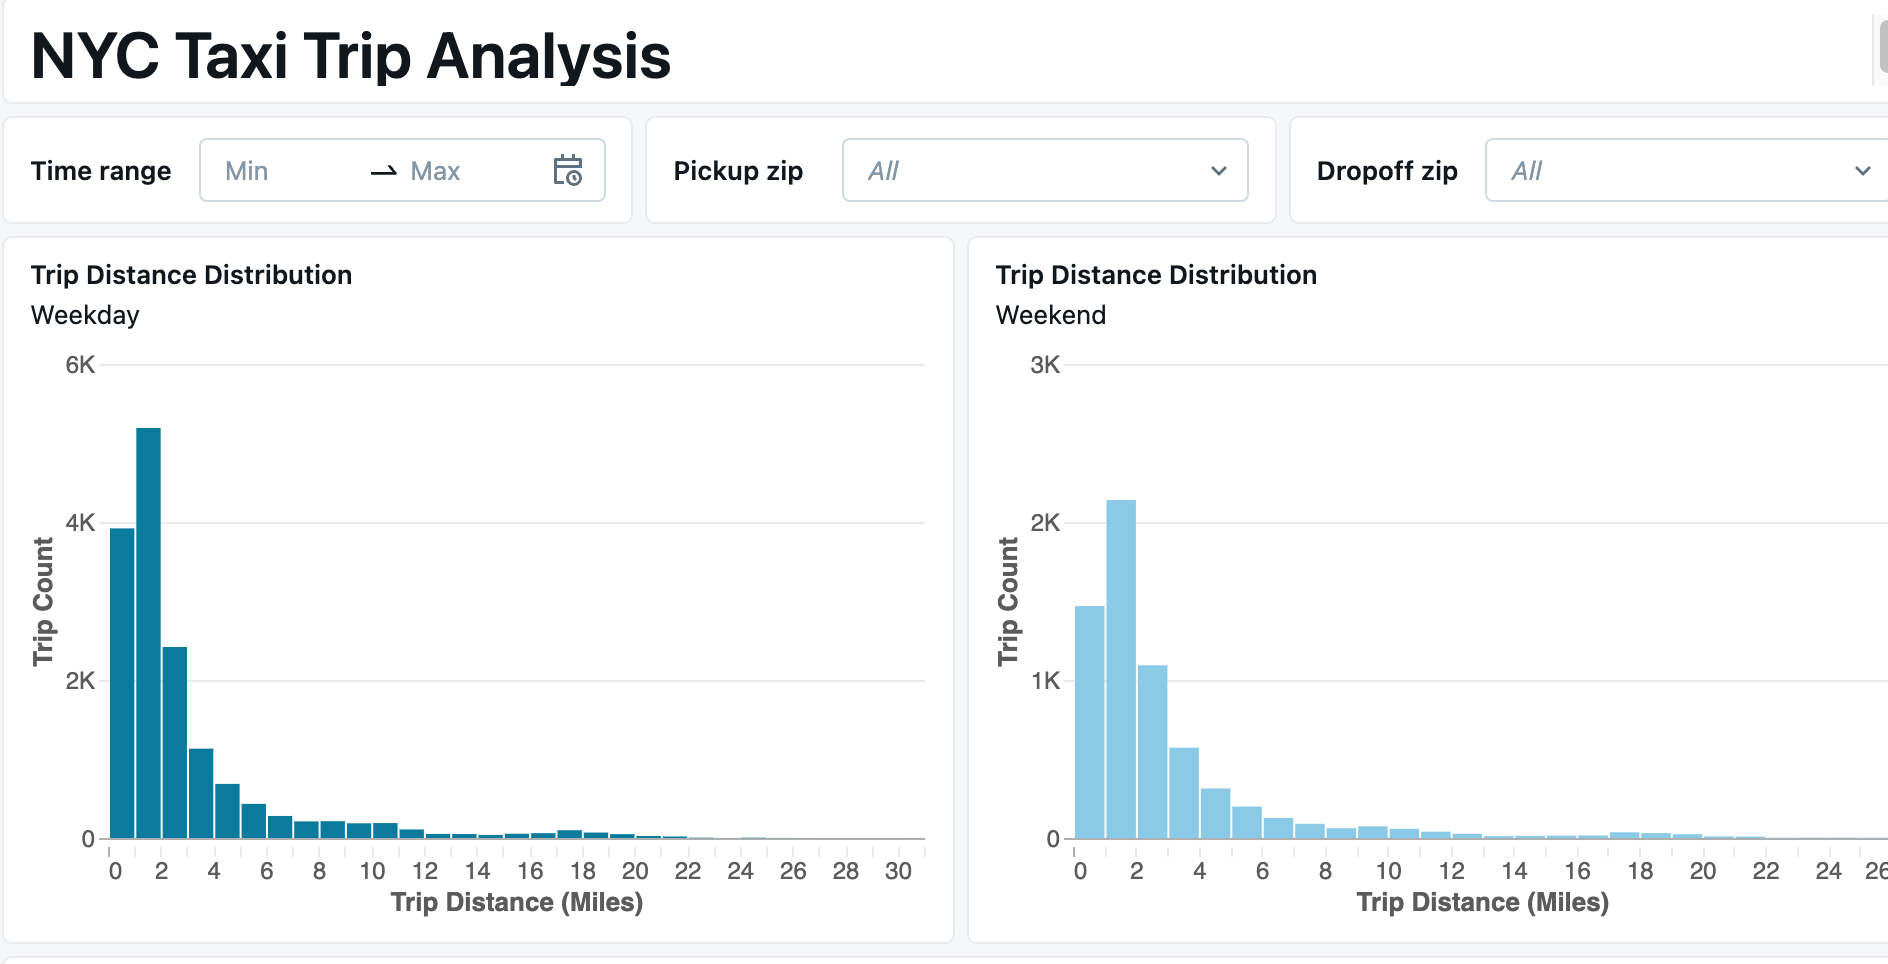
Review your dashboard.
The following image shows two visualization widgets. Each is configured as a histogram with a static widget parameter. The chart on the left shows the distribution of trip distances for trips starting on weekdays, while the chart on the right shows the same data for weekends. Both visualizations are based on the same dataset.
Compare data using a filter condition
You can add a filter condition that allows you to compare aggregations on the part of the data to the aggregations applied to the whole data set.
The following example extends the previous query to include a filter condition where the specified parameter value is All, which does not appear in the data. The first part of the filter condition works the same as in the previous example, filtering for results where the day_type is either Weekday or Weekend. The second part of the filter condition checks if the parameter itself is set to a certain value, in this case All, that does not appear in the data. When you set the default value for that parameter in the dataset editor, you’re effectively bypassing the filter when neither Weekday nor Weekend are passed in as values.
WITH DayType AS (
  SELECT
    CASE
      WHEN DAYOFWEEK(tpep_pickup_datetime) IN (1, 7) THEN 'Weekend'
      ELSE 'Weekday'
    END AS day_type,
    trip_distance
  FROM
    samples.nyctaxi.trips
)
SELECT
  day_type,
  trip_distance
FROM
  DayType
WHERE
  day_type = :day_type_param
  OR :day_type_param = 'All'
You can use this dataset to configure three visualization widgets, with the day_type_param set to All, Weekday and Weekend respectively. Then, dashboard viewers can compare each dataset filtered by day type to the whole dataset.
The following GIF shows how you can quickly build three charts from the dataset created with this query.
The first chart is configured to show the Trip Distances by Day Type dataset with a parameter value set to Weekday.
Clone the chart to maintain all the applied configurations.
To show data for trips taken on the weekend, adjust the static parameter to Weekend.
Clone the new chart to maintain all of the previously applied configurations.
Set the parameter in the new chart to All to show total trip counts by distance for weekend and weekday trips.
Show parameters on the dashboard
Adding a filter to your dashboard canvas allows viewers to select and modify parameter values to interactively explore and analyze the data. If you do not expose the parameter on the dashboard, viewers only see query results that use the default parameter value that you set in the query.
To add a parameter to your dashboard:
Click
 Add a filter (field/parameter).
Click
 next to Parameters in the configuration panel.
Click the parameter name you want the viewer to use with this widget.
Working with filter widgets and static parameters
Parameters are fixed values substituted into a query at runtime. If two or more references to the same parameter are set with different values when your dashboard updates, visualization widgets display an error indicating which parameter has conflicting values. This can occur when multiple filter widgets use the same parameter or when a static parameter conflicts with a filter widget that allows viewer selection.
You could use a pattern like the one in the following example to set fallback values for different parameters in the same query.
CASE WHEN :static_param != 'All' THEN :static_param ELSE :dash_param END
In this example, :static_param refers to a static parameter, which should be set to ‘All’ in both the visualization widget and dataset editor. The parameter :dash_param is a dynamic value that is controlled by a filter widget on the dashboard canvas. This statement checks for a value provided as a static parameter. If none is set, it falls back to a viewer-selected dashboard parameter value.
Include parameters in the URL
Parameter settings are stored in the URL, allowing users to bookmark it to maintain their dashboard’s state, including pre-set filters and parameters, or to share it with others to apply the same filters and parameters consistently.
Dashboard parameters vs. Mustache query parameters
Dashboard parameters use the same syntax as named parameter markers. See Named parameter markers. Dashboards do not support Mustache style parameters.
Syntax examples
Common uses for parameters include inserting dates, numbers, text, database objects, and values from JSON strings. For examples that demonstrate how to use parameters in these cases, see Named parameter syntax examples
Important
Enabling viewers to access data through parameter selections like table or catalog names could lead to accidental exposure of sensitive information. If you’re publishing a dashboard with these options, Databricks recommends not embedding credentials in the published dashboard.