Embed a dashboard
This article explains how to embed an AI/BI dashboard in an external website or application. A workspace admin must define potential embedding surfaces before dashboards can be embedded. For details about configuring your workspace Manage dashboard embedding.
Users with at least CAN EDIT permission can generate iframe code for a dashboard from the Share dialog. All sharing settings for the published dashboard remain in effect. Only users who have been explicitly granted access can view the embedded dashboards. See Share a dashboard to learn more about sharing dashboards. Embedded dashboards follow the same cache and refresh cadence as all other dashboards. See Caching and data freshness.
Generate embed code
To embed a dashboard, use the following steps:
Open a published dashboard that you want to embed. See View and organize dashboards to learn how to view and access dashboards in your workspace.
Click Share in the upper-right corner.
Click Embed dashboard in the Sharing dialog.
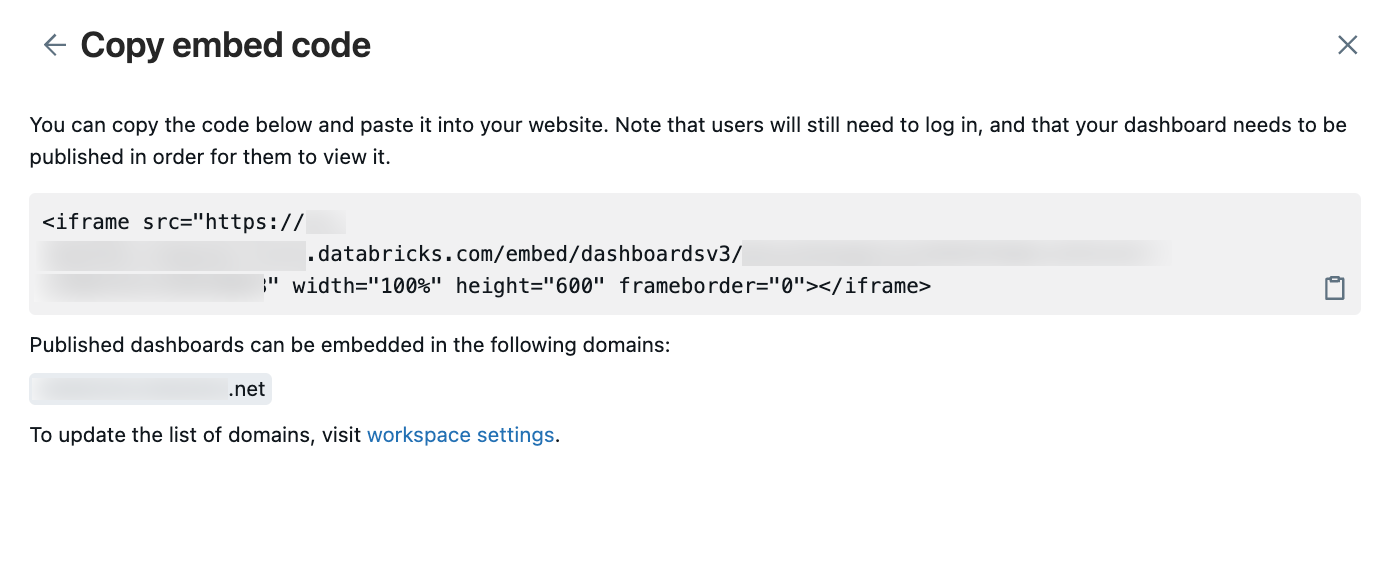
A Copy embed code dialog opens. If a list of allowed embedding domains exists, the domains are listed. Click
 the copy button to copy the code snippet.
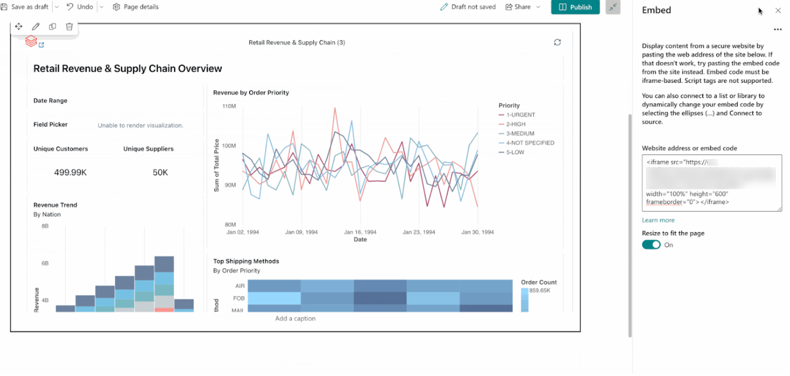
Insert the embed code into any platform or application that supports HTML embedding and can render iframe content. See Examples.
Note
If your Copy embed code dialog includes a list of allowed domains that does not include your target domain, a workspace admin can add it. See Manage dashboard embedding.
Examples
The following examples include step-by-step guidance for embedding your dashboards in an application. Each set of instructions assumes that you have already copied the embed code outlined in the previous section.
Embed in Confluence
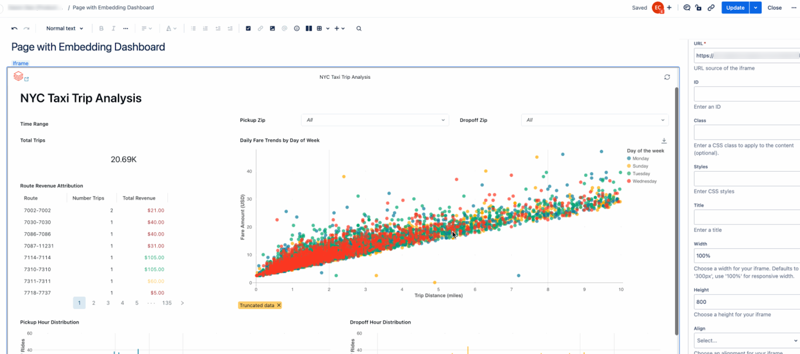
The generated embed code requires a slight adjustment to meet Confluence’s requirements. To embed your dashboard in a Confluence page, complete the following steps:
Edit the embed code to include only the generated URL, not the iframe tags or additional markup values.
Before editing, the embed code includes an iframe HTML tag, a link to your dashboard to use a the source in the iframe, and additional specifications for height, width, and border as shown in the following code snippet. For your dashboard, the example placeholders
<databricks-instance-name>and<dashboard-and-workspace-ID>contain the actual values associated with your workspace and dashboard. They are as follows:Your
<databricks-instance-name>is the first part of the URL when you log into your workspace. See Get identifiers for workspace objects.The
<dashboard-and-workspace-ID>is the last part of the URL that points to your dashboard. It looks something like:a4bf23c498752e79f1a2d6b4c9087e31?o=3498561237865447.
<iframe src="https://<databricks-instance-name>/embed/dashboardsv3/<dashboard-and-workspace-ID>" width="100%" height="600" frameborder="0"></iframe>
Edit the string so that it includes only the link text as shown in the following example.
https://<databricks-instance-name>/embed/dashboardsv3/<dashboard-and-workspace-ID>
Insert an iframe element into your page. To learn how to insert an iframe into your page, see Confluence’s documentation.
Paste the edited embed URL in the URL text field and set the width to 100%.
Adjust other settings according to your preference.

Embed in Salesforce Knowledge
To embed your dashboard in a Salesforce Knowledge page, complete the following steps:
Create a Visualforce page. For instructions, see Salesforce’s documentation.
From the Page Edit screen, move your cursor into the Visualforce Markup editor.
Paste the embed code that you copied between the two
<apex:page></apex:page>tags.Add two paragraph tags (
<p></p>) around the embed code.The following example uses the placeholder
<dashboard-embed-code>to demonstrate what your Visualforce markup should look like. Your instance should include the complete embed code that you copied.<apex:page > <p><dashboard-embed-code></p> </apex:page>
Click Save to save your changes.
Click Preview and confirm that the dashboard renders.
Copy the URL of the component preview and create a new iframe component. It should look like the following code snippet. The placeholder
<your-salesforce-domain>should be replaced with your Salesforce domain.<iframe src="https://<your-salesforce-domain>/apex/<component name>" width="100%" height="600" frameborder="0"></iframe>
Go to the Knowledge page where you want to embed your dashboard.
Click Edit>Add a media component.
Paste the iframe code from the previous step into the Embed text field.
Embed a single widget
To embed a single widget from a dashboard, you need the dashboard embed code and the unique identifier of the widget you want to show.
To find the widget ID:
Open your published dashboard in the Databricks workspace.
Click the
 kebab menu for the widget you want to embed.
Click View fullscreen. The new URL contains the widget ID.
Copy the widget ID from the URL. Is appears after
widgets%2F.The following example shows the last part of the URL for a fullscreen widget:
widgets%2F01ef9213e9d51cdab682d58754c03f51
In this case, the widget ID is
01ef9213e9d51cdab682d58754c03f51
Adjust the generated embed code:
See Generate embed code to find the steps for generating the dashboard’s embed code.
Add
&fullscreenWidget={ID}to the embed URL, replacingIDwith the widget ID.
For example, if your base embed URL is as follows:
src="https://<databricks-instance-name>/embed/dashboardsv3/<dashboard-and-workspace-ID>&fullscreenWidget={ID}"
The updated embed URL with the widget ID should look like the following:
src="https://<databricks-instance-name>/embed/dashboardsv3/<dashboard-and-workspace-ID>&fullscreenWidget={01ef9213e9d51cdab682d58754c03f51}"
View an embedded dashboard
Embedded dashboards offer a secure way for viewers to access dashboard data outside of Databricks. All existing sharing settings apply. Intended viewers must be granted access to the dashboard. See Who can access your dashboard?.
To view an embedded dashboard:
Navigate to the page where the dashboard has been embedded.
If necessary, log in with Databricks credentials.
Note
If a registered user who has not been granted access to the dashboard tries to view it, they receive an error that says the dashboard is unavailable. See Share a published dashboard to learn how to adjust sharing settings.
Refresh an embedded dashboard
All viewers of an embedded dashboard can manually refresh dashboards on demand. You can also set up a schedule to refresh dashboards periodically.
Troubleshooting embedded dashboards
This section lists common problems that you might encounter and offers a suggested resolution:
The embedded iframe is blank
If the embedded iframe is not displaying data, it might be because you have disabled third-party cookies. Enabling third-party cookies is often necessary to allow external content, such as embedded dashboards, to function correctly within another web page.
You can adjust your browser settings to allow or unblock third-party cookies to resolve this issue. If you don’t want to allow all third party cookies, many browsers allow you to add exceptions for specific sites on which third-party cookies should be allowed. Refer to your browser’s help documentation for detailed instructions on managing cookies.
