Table options
With Databricks table visualizations you can manually reorder, hide, and format data. This article describes how you can control data presentation in table visualizations.
A table visualization can be manipulated independently of the original cell results table.
You can:
Reorder columns by dragging them up or down using the
 handle
Hide columns by toggling the
 icon
iconFormat columns using the format settings
Format columns
You can format some common data types–text, numbers, dates, and Booleans. Databricks also has special support for non-standard column types like images, JSON documents, and links. To display type-specific formatting options, select the type in the Display as field.
Conditionally format column colors
You can configure the font colors for column results to a static color or a range of colors based on comparing the column value to a threshold.
Edit the visualization.
Optionally, set the default font color to a non-default value.
Under Font Conditions, click + Add condition.
Select the column, the threshold, the comparator, and the font color if the comparison succeeds.
The threshold can be a numeric type, string, or date. For the comparison to succeed, the threshold must be the same data type as the column. For example, to colorize results whose values exceed the numeric value
500000, create the threshold> 500000, rather than> 500,000. Numeric types, strings, and dates are supported.Optionally add more conditions.
Common data types
You can control how data is displayed. For example, you can:
Display floats out to three decimal places
Show only the month and year of a date column
Zero-pad integers
Prepend or append text to your number fields
Text
The Allow HTML content field has the following behavior:
Enabled: HTML content is run through an HTML sanitizer and the column is rendered as HTML.
Disabled: The content is displayed without rendering the HTML.
Special data types
Databricks supports the following special data types: image, JSON, and link.
Image
If a field in your database contains links to images, select Image to display the images inline with your table results. This is especially useful for dashboards. In the following dashboard, the Customer Image field is a link to an image that Databricks displays in-place.

JSON
If your data returns JSON formatted text, select JSON. This lets you collapse and expand elements in a clean format.
Link
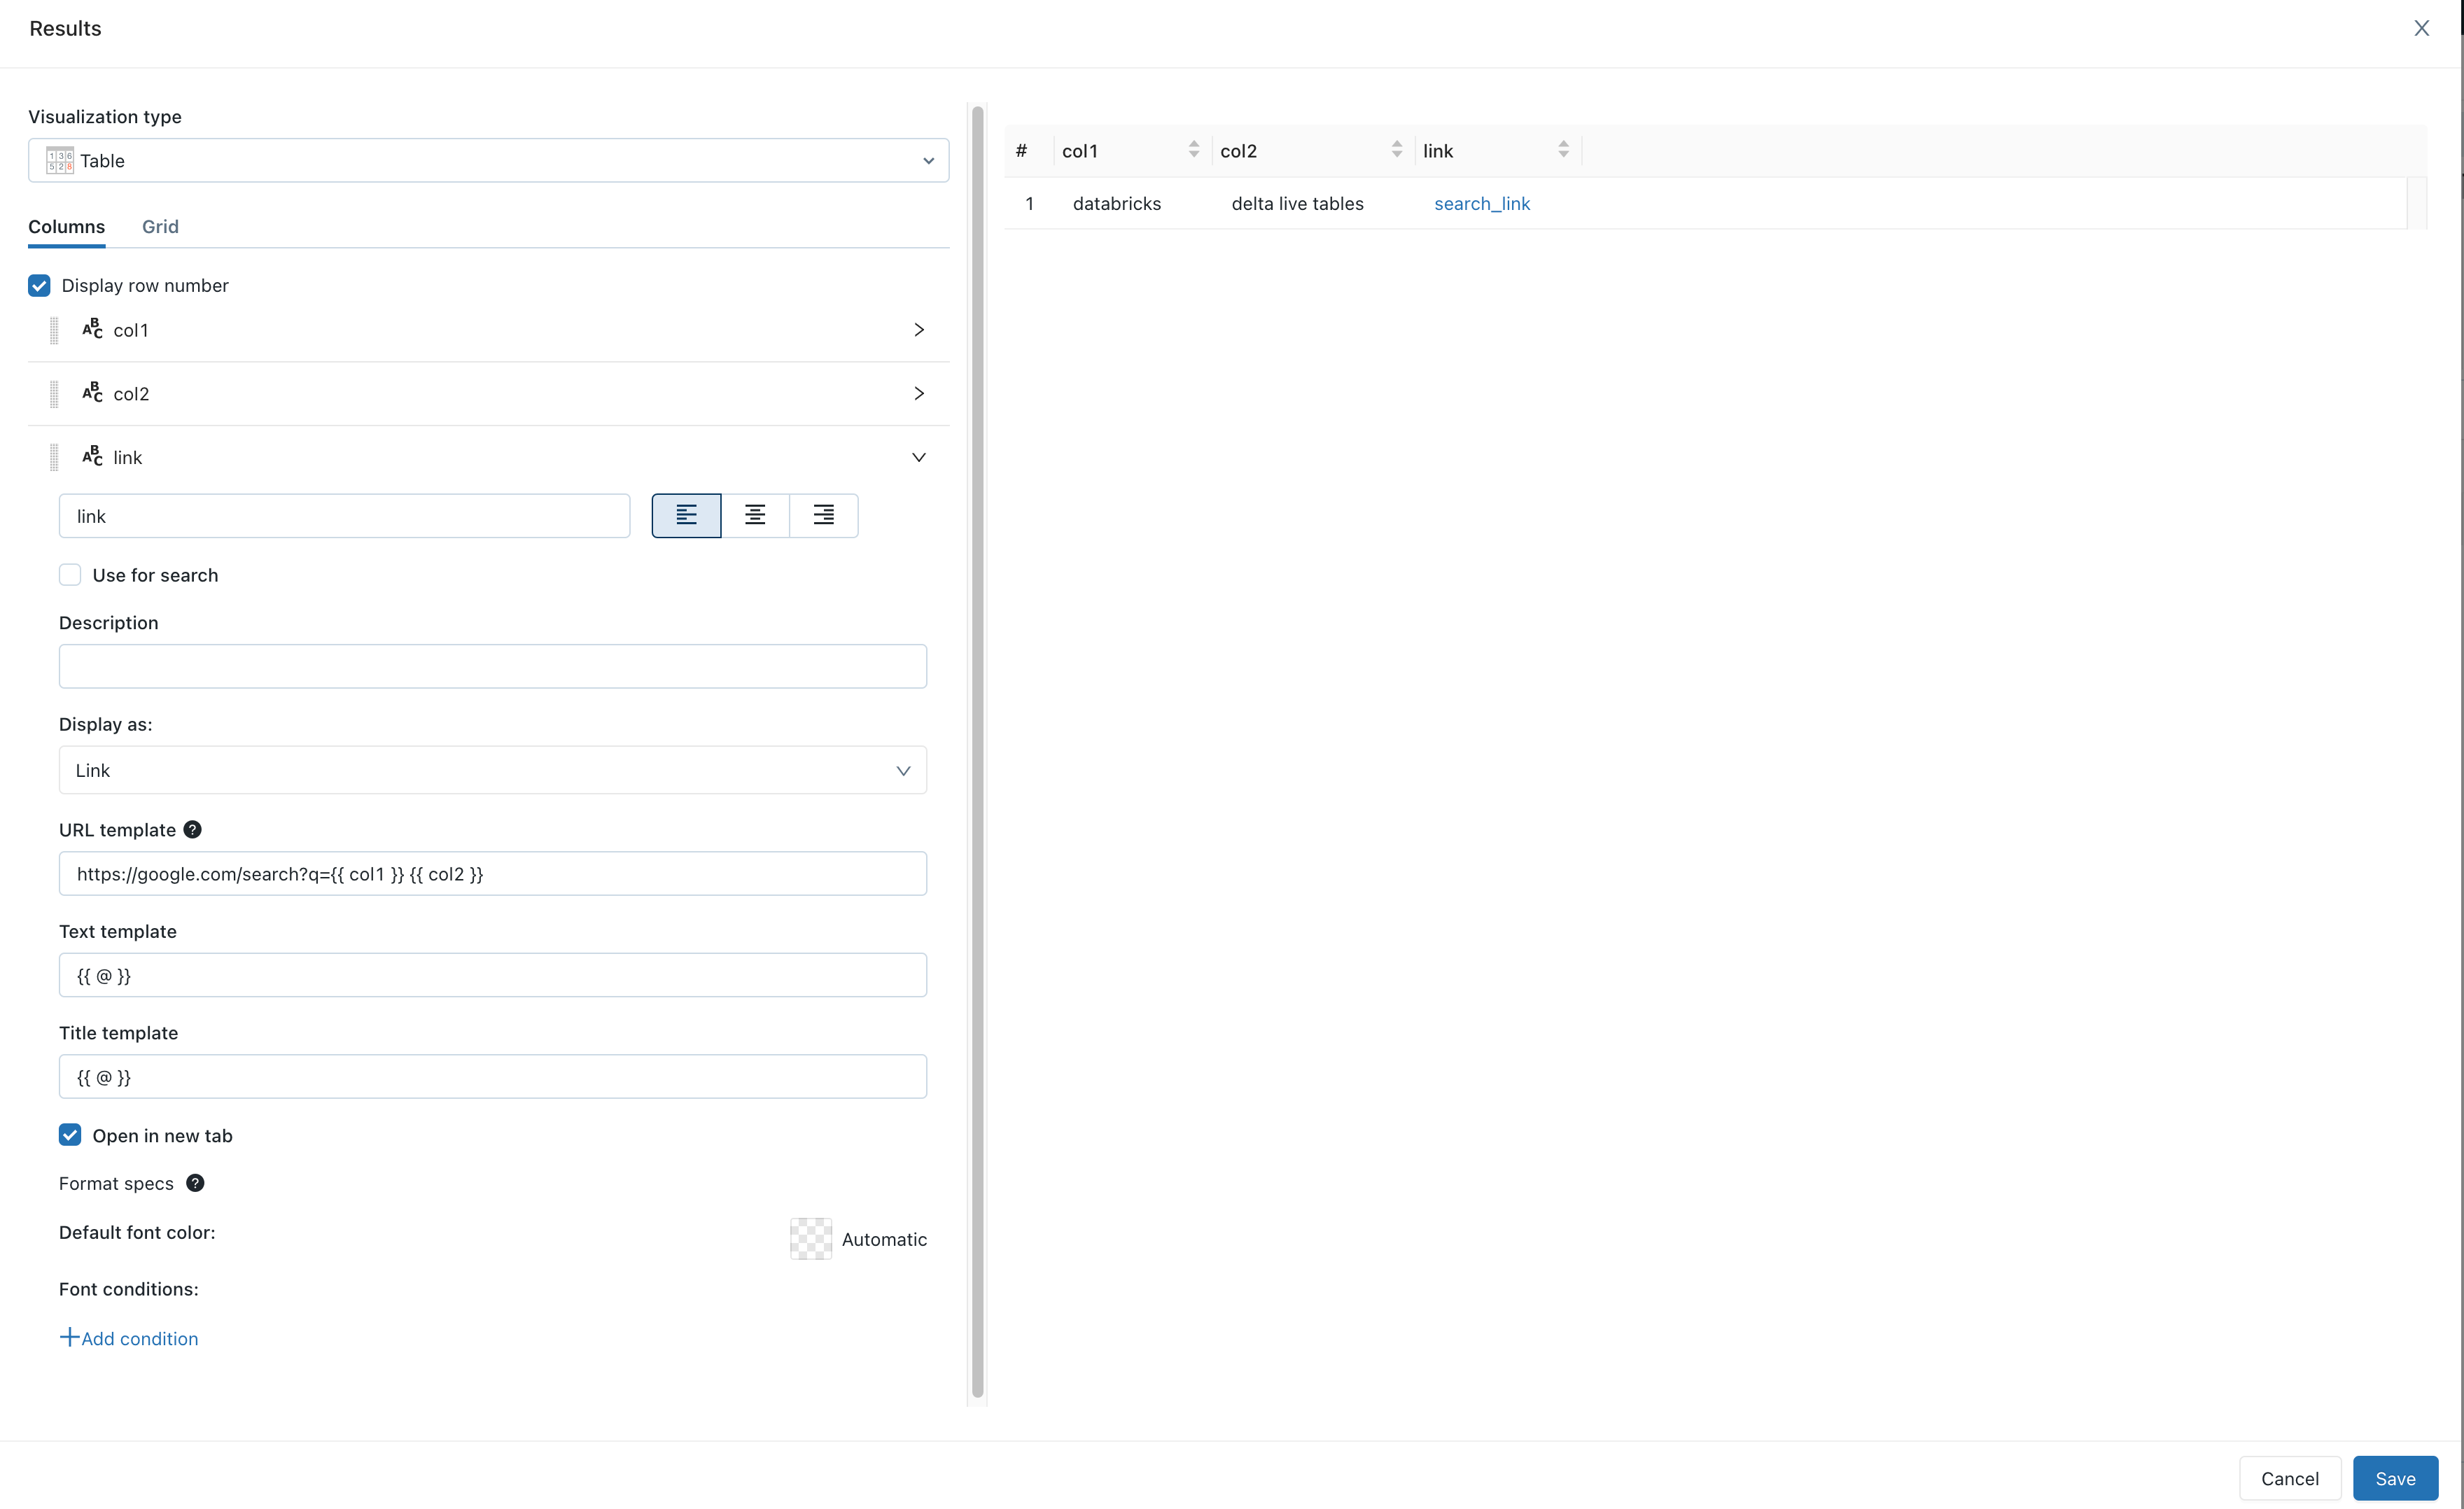
To make HTML links from your dashboard clickable, select Link. Three fields appear: URL template, Text template, Title template. These template fields control how an HTML link is rendered. The fields accept mustache-style parameters (double curly braces) for the column names in the table. The mustache parameters support the pipe filter urlEscape, which URL-escapes the value.

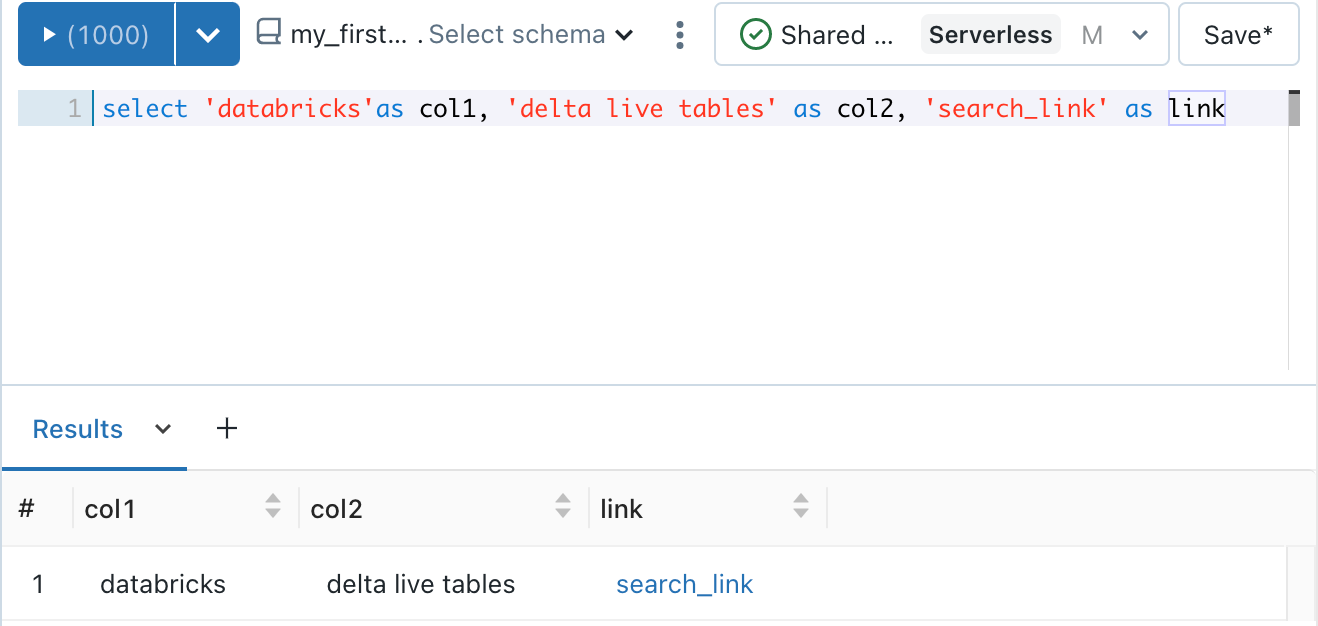
The query in the following screenshot generates a result set containing the search URL. If you hover over the link in the result set, you see the URL in the lower left corner. Click the URL in the result set to view the search results in your browser.
