Diagnose cost and performance issues using the Spark UI
This guide walks you through how to use the Spark UI to diagnose cost and performance issues. It’s a step-by-step guide, and it’s a practical how-to. Rather than just providing you an explanation of what each page in the Spark UI does, it tells you what to look for and what it means. If you aren’t familiar with the concepts of driver, workers, executors, stages, and tasks, you might want to review the Spark architecture.
If you are looking for a comprehensive list of various optimization tools, use the Databricks Optimization guide. Sections of the optimization guide are referenced in this Spark UI guide.
Using this guide
To navigate through the guide, use the links embedded in each page to be taken to the next step. The guide contains the following steps in order:
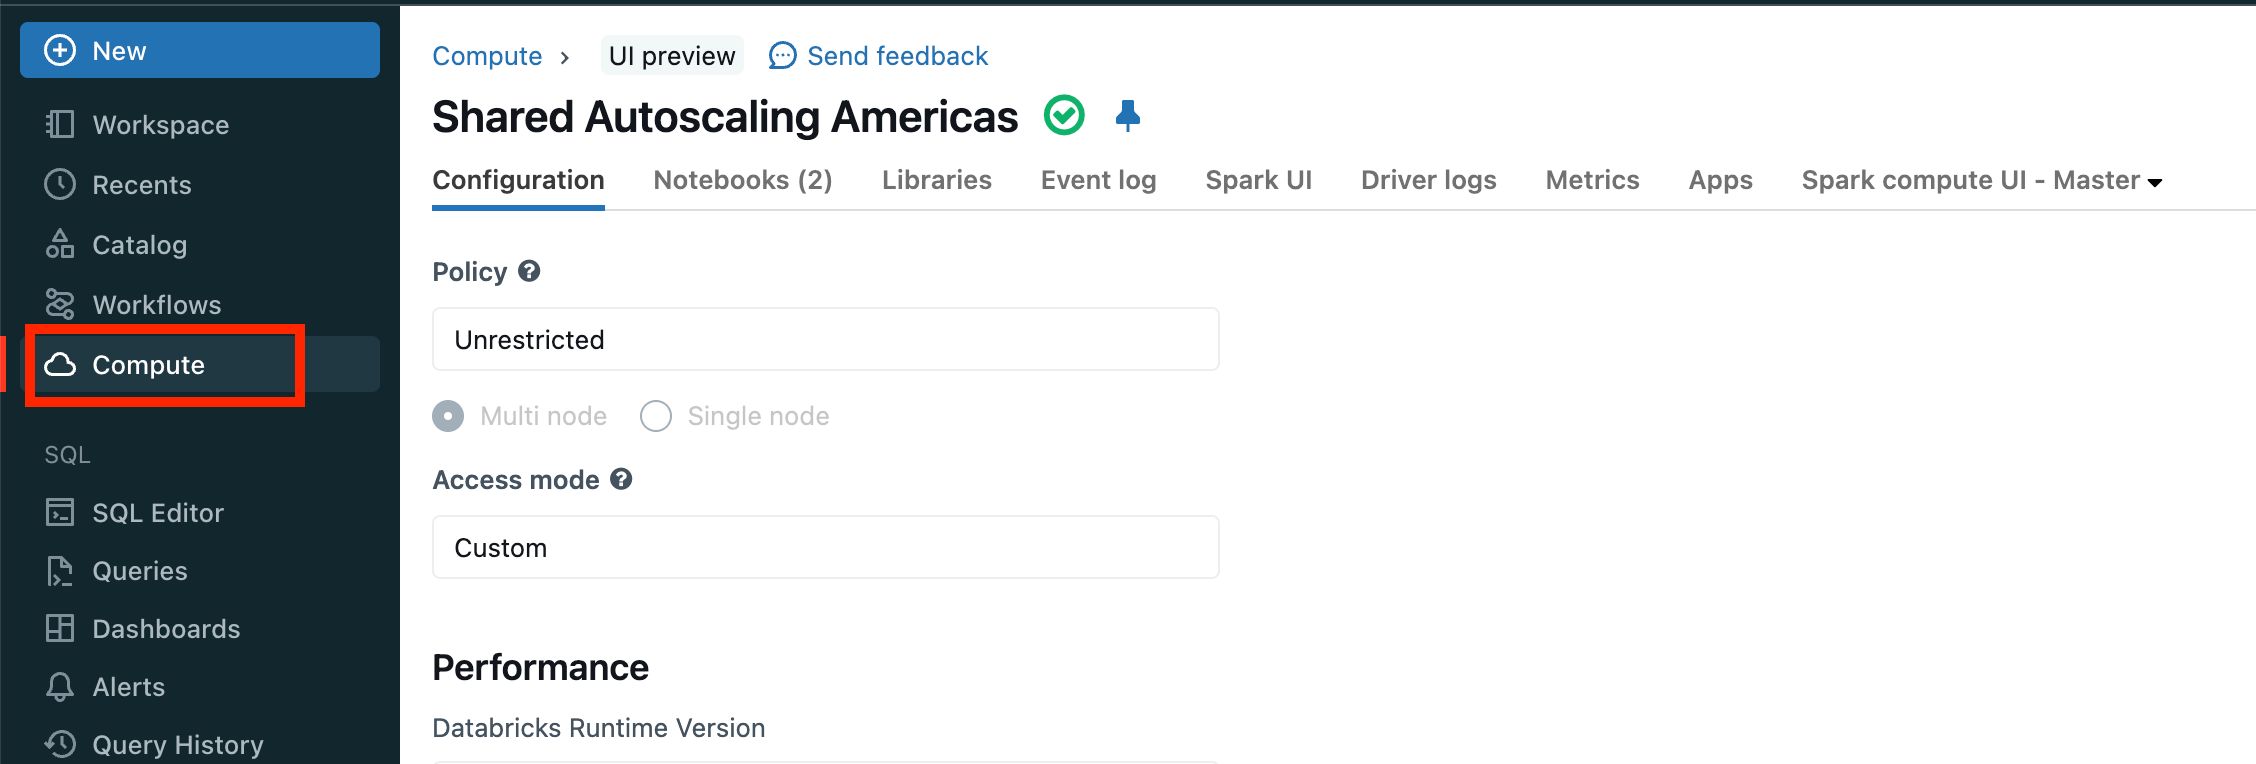
Let’s get started!
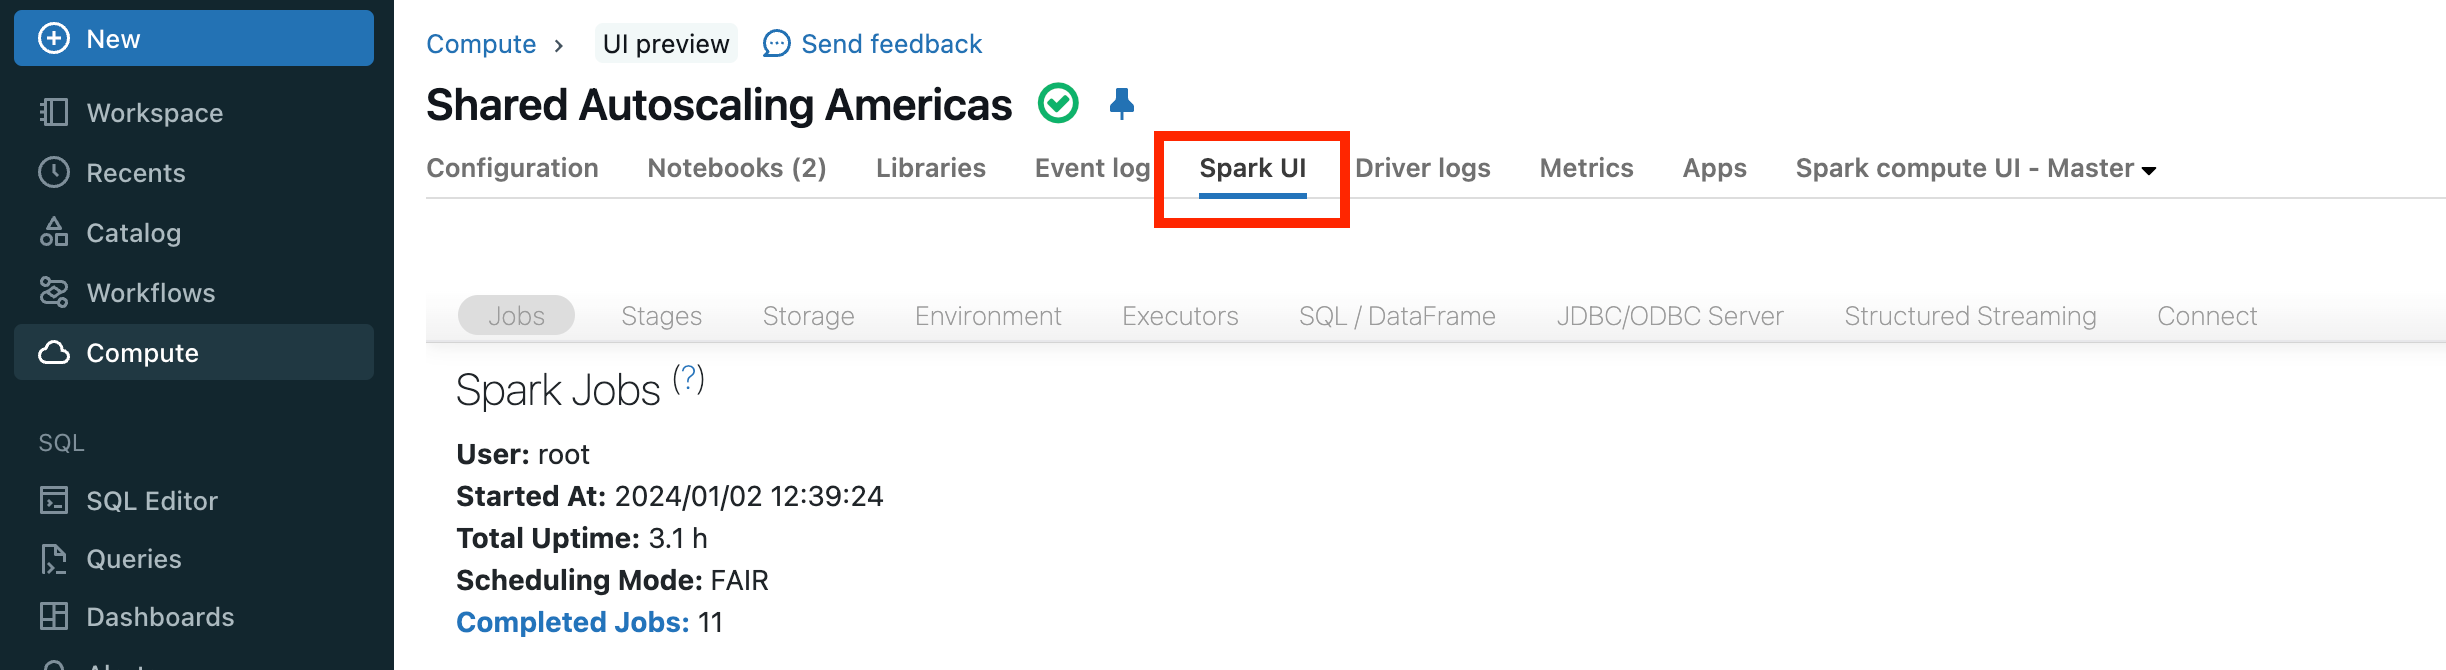
Next step
Now that you’ve opened the Spark UI, next review the event timeline to find out more about your pipeline or query. See Jobs timeline.