Write queries and explore data in the SQL editor
The Databricks UI includes a SQL editor that you can use to author queries, browse available data, and create visualizations. You can also share your saved queries with other team members in the workspace. This article explains how to use the SQL editor to write, run, and manage queries. A new version of the SQL editor is in Public Preview. To learn how to enable and work with the new SQL editor, see Collaborate with colleagues using the new SQL editor.
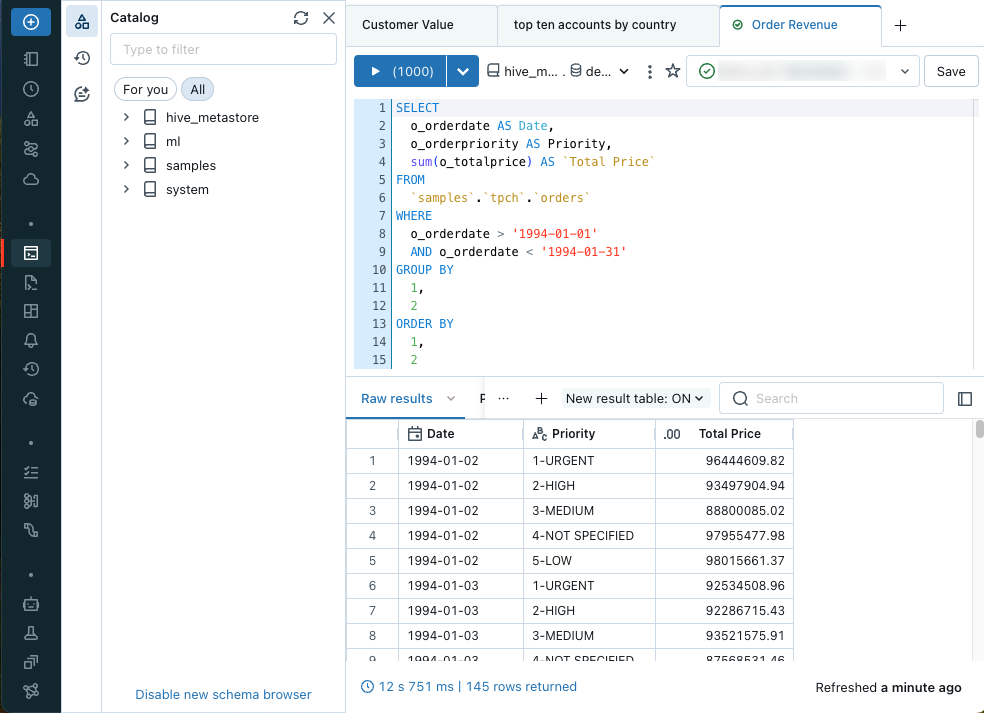
After opening the editor, you can author a SQL query or browse the available data. The text editor supports autocomplete, autoformatting, and various other keyboard shortcuts.
You can open multiple queries using the query tabs at the top of the text editor. Each query tab has controls for running the query, marking the query as a favorite, and connecting to a SQL warehouse. You can also Save, Schedule, or Share queries.
Open the SQL editor
To open the SQL editor in the Databricks UI, click ![]() SQL Editor in the sidebar.
SQL Editor in the sidebar.
The SQL editor opens to your last open query. If no query exists, or all of your queries have been explicitly closed, a new query opens. It is automatically named New Query and the creation timestamp is appended in the title.
Connect to compute
You must have at least CAN USE permissions on a running SQL warehouse to run queries. You can use the drop-down near the top of the editor to see available options. To filter the list, enter text in the text box.
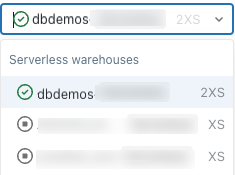
The first time you create a query, the list of available SQL warehouses appears alphabetically. The last used SQL warehouse is selected the next time you create a query.
The icon next to the SQL warehouse indicates the status:
Running

Starting

Stopped

Note
If there are no SQL warehouses in the list, contact your workspace administrator.
The selected SQL warehouse will restart automatically when you run your query. See Start a SQL warehouse to learn other ways to start a SQL warehouse.
Browse data objects in SQL editor
If you have metadata read permission, the schema browser in the SQL editor shows the available databases and tables. You can also browse data objects from Catalog Explorer.
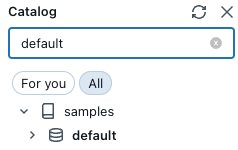
You can navigate Unity Catalog-governed database objects in Catalog Explorer without active compute. To explore data in the hive_metastore and other catalogs not governed by Unity Catalog, you must attach to compute with appropriate privileges. See Data governance with Unity Catalog.
Note
If no data objects exist in the schema browser or Catalog Explorer, contact your workspace administrator.
Click ![]() near the top of the schema browser to refresh the schema. You can filter the schema by typing filter strings in the search box.
near the top of the schema browser to refresh the schema. You can filter the schema by typing filter strings in the search box.
Click a table name to show the columns for that table.
Create a query
You can enter text to create a query in the SQL editor. You can insert elements from the schema browser to reference catalogs and tables.
Type your query in the SQL editor.
The SQL editor supports autocomplete. As you type, autocomplete suggests completions. For example, if a valid completion at the cursor location is a column, autocomplete suggests a column name. If you type
select * from table_name as t where t., autocomplete recognizes thattis an alias fortable_nameand suggests the columns insidetable_name.
(Optional) When you are done editing, click Save. By default, the query is saved to your user home folder, or you can select a different location. Then, click Save.
Turn autocomplete on and off
Live autocomplete can complete schema tokens, query syntax identifiers (like SELECT and JOIN), and the titles of query snippets. It’s enabled by default unless your database schema exceeds five thousand tokens (tables or columns).
Use the toggle beneath the SQL editor to turn live autocomplete off or on.
To turn off live autocomplete, press Ctrl + Space or click the
 button beneath the SQL editor.
Save queries
The Save button near the top-right of the SQL editor saves your query.
Important
When you modify a query but don’t explicitly click Save, that state is retained as a query draft. Query drafts are retained for 30 days. After 30 days, query drafts are automatically deleted. To retain your changes, you must explicitly save them.
Edit multiple queries
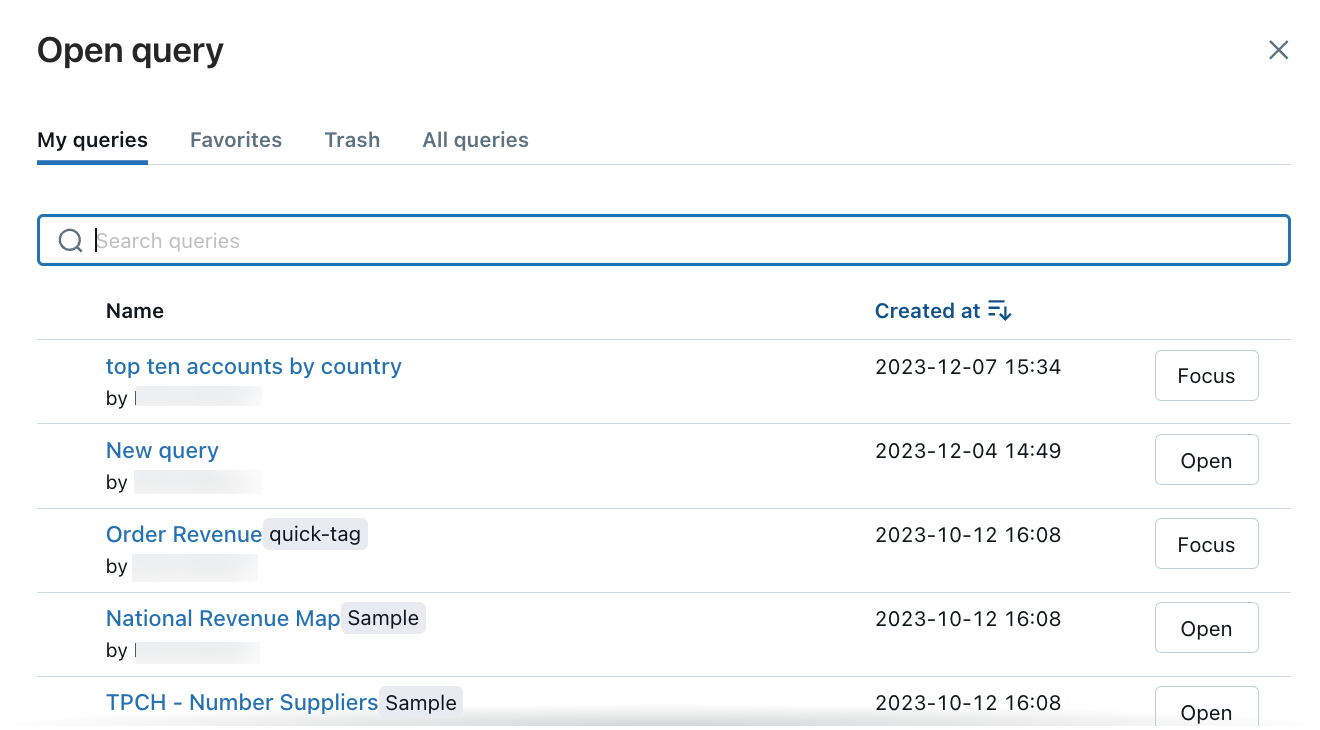
By default, the SQL editor uses tabs so you can edit multiple queries simultaneously. To open a new tab, click +, then select Create new query or Open existing query. Click Open existing query to see your list of saved queries. click My Queries or Favorites to filter the list of queries. In the row containing the query you want to view, click Open.
Run a single query or multiple queries
To run a query or all queries:
Select a SQL warehouse.
Highlight a query in the SQL editor (if multiple queries are in the query pane).
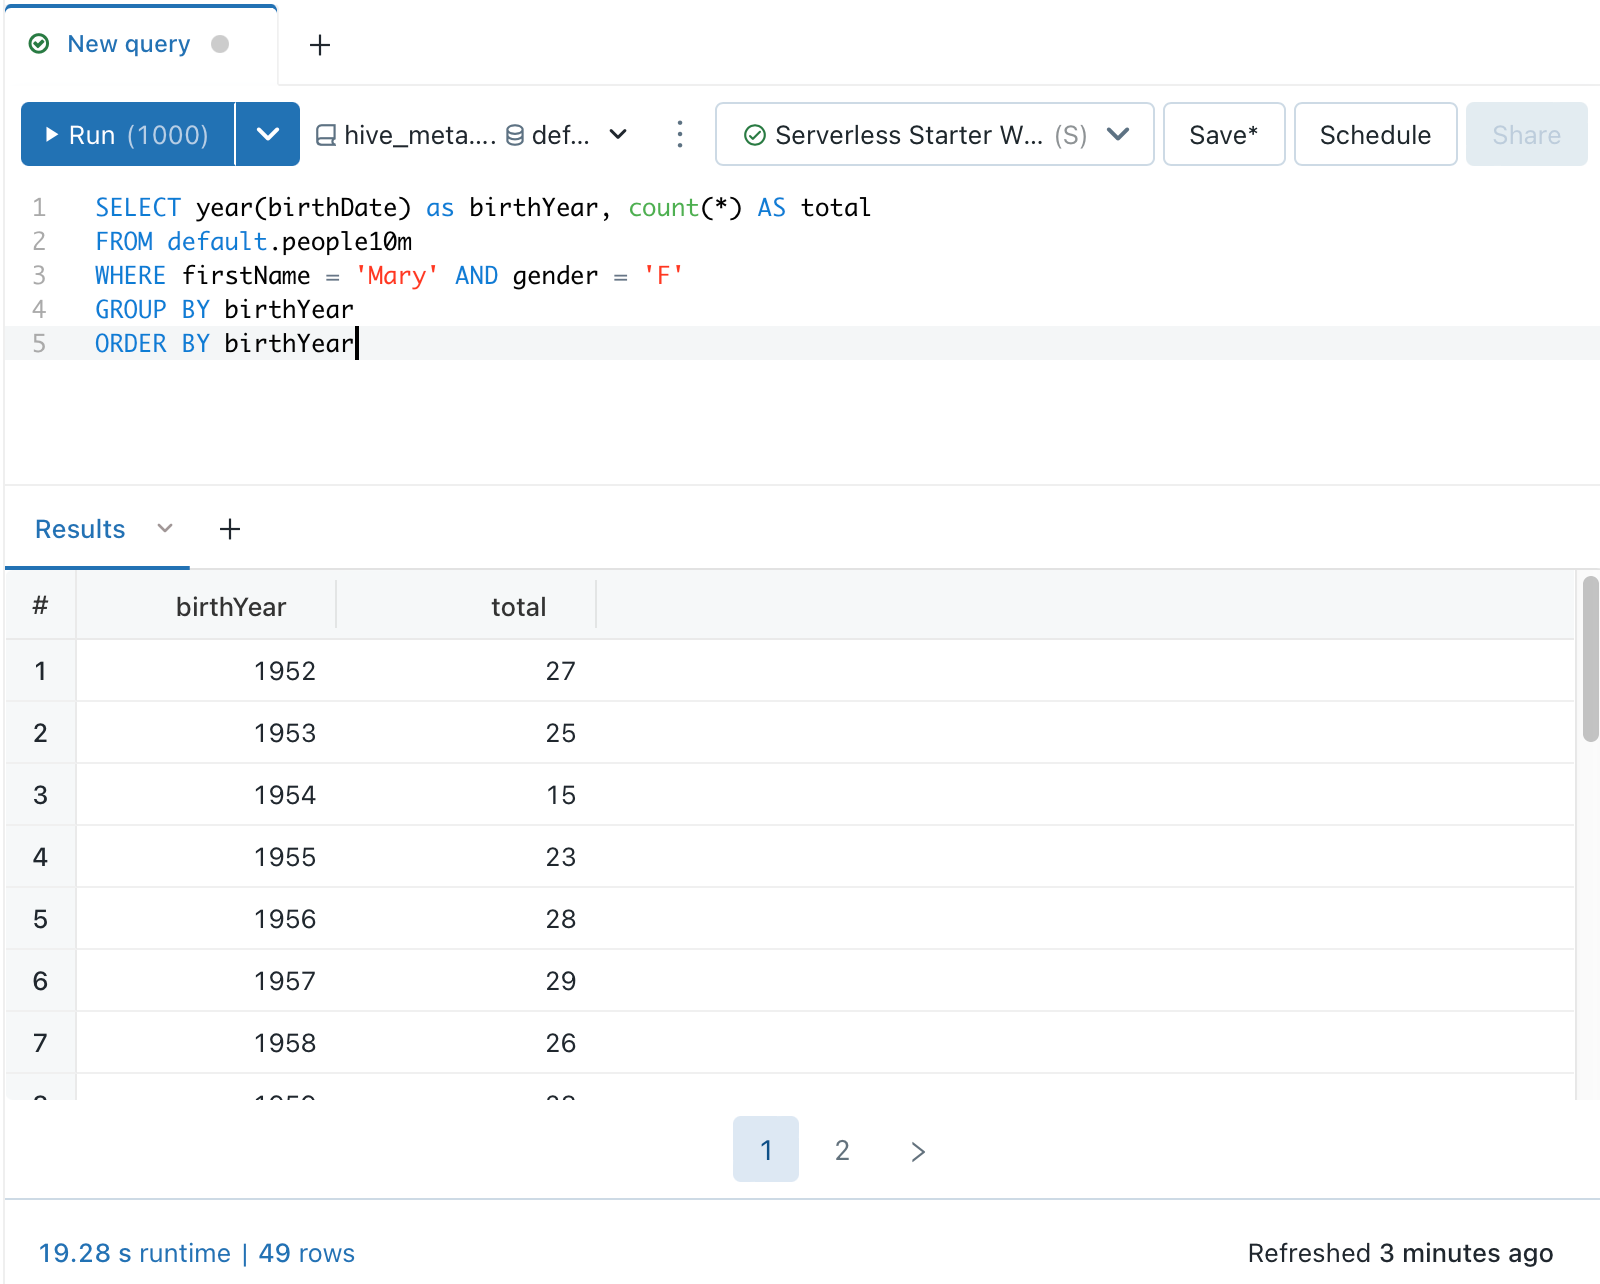
Press Ctrl/Cmd + Enter or click Run (1000) to display the results as a table in the results pane.
Note
Limit 1000 is selected by default for all queries to limit the query return to 1000 rows. If a query is saved with the Limit 1000 setting, this setting applies to all query runs (including in dashboards). To return all rows for this query, you can unselect LIMIT 1000 by clicking the Run (1000) drop-down. If you want to specify a different limit on the number of rows, you can add a LIMIT clause in your query with a value of your choice.
Terminate a query
To terminate a query while it is executing, click Cancel. An administrator can stop an executing query that another user started by viewing the Terminate an executing query.
Query options
You can use the  kebab context menu near the top of the query editor to access menu options to clone, revert, format, and edit query information.
Revert to saved query
When you edit a query, a Revert changes option appears in the context menu for the query. You can click Revert to go back to your saved version.
Discarding and restoring queries
To move a query to trash:
Click the kebab context menu
 next to the query in the SQL editor and select Move to Trash.
Click Move to trash to confirm.
To restore a query from trash:
In the All Queries list, click
 .
.Click a query.
Click the kebab context menu
 at the top-right of the SQL editor and click Restore.
Set query description and view query info
To set a query description:
Click the
 kebab context menu next to the query and click Edit query info.
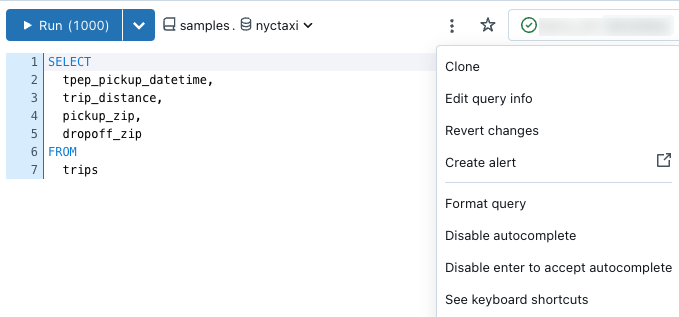
In the Description text box, enter your description. Then, click Save. You can also view the history of the query, including when it was created and updated, in this dialog.
Favorite and tag queries
You can use favorites and tags to filter the lists of queries and dashboards displayed on your workspace landing page, and on each of the listing pages for dashboards and queries.
Favorites: To favorite a query, click the star to the left of its title in the Queries list. The star will turn yellow.
Tags: You can tag queries and dashboards with any meaningful string to your organization.
Add a tag
Add tags in the query editor.
Click the
 kebab context menu next to the query and click Edit query info. A Query info dialog appears.
If the query has no tags applied,Add some tags shows in the text box where tags will appear. To create a new tag, type it into the box. To enter multiple tags, press tab between entries.
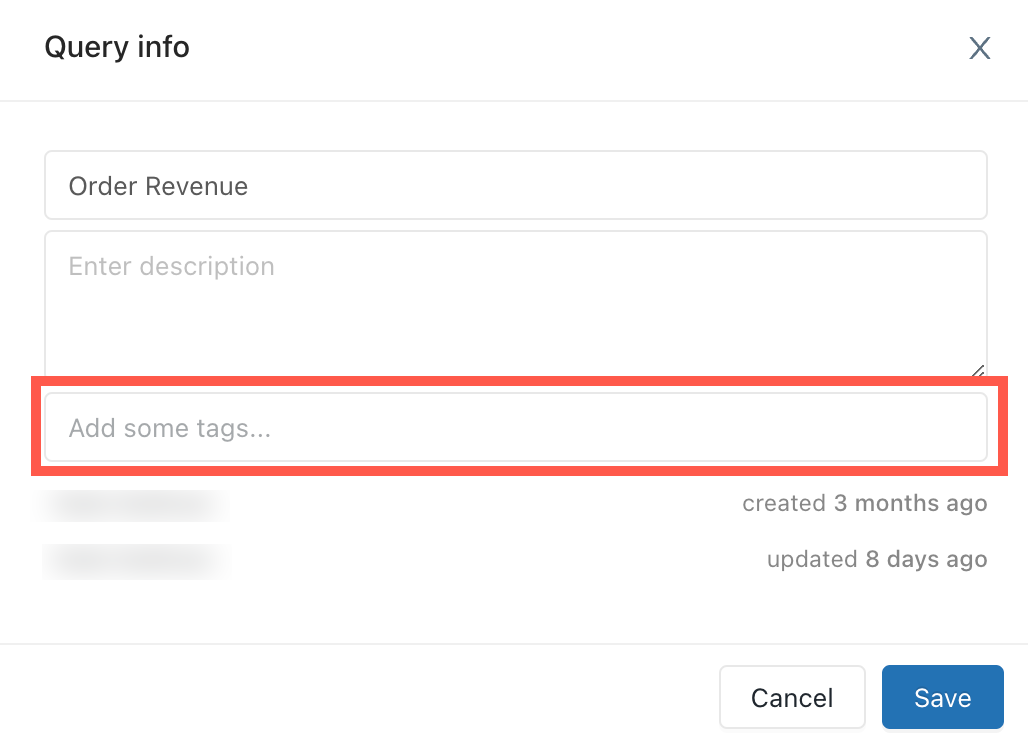
Click Save to apply the tags and close the dialog.
View query results
After a query runs, the results appear in the pane below it. The New result table is ON for new queries. If necessary, click the drop-down to turn it off. The images in this section use the new result table.
You can interact with and explore your query results using the result pane. The result pane includes the following features for exploring results:
Visualizations, filters, and parameters
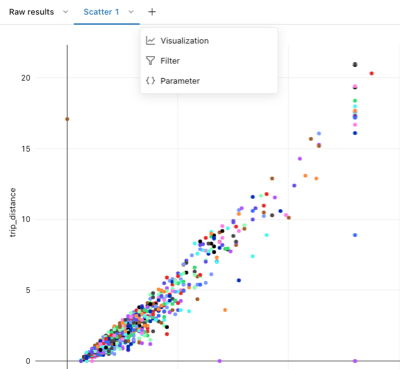
Click the ![]() to add a visualization, filter, or parameter. The following options appear:
to add a visualization, filter, or parameter. The following options appear:
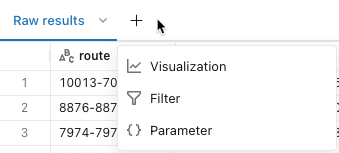
Visualization: Visualizations can help explore the result set. See Visualization types for a complete list of available visualization types.
Filter: Filters allow you to limit the result set after a query has run. You can apply filters to selectively show different subsets of the data. See Query filters to learn how to use filters.
Parameter: Parameters allow you to limit the result set by substituting values into a query at runtime. See Work with query parameters to learn how to apply parameters.
Edit, download, or add to a dashboard
Important
Databricks recommends using AI/BI dashboards (formerly Lakeview dashboards). Earlier versions of dashboards, previously referred to as Databricks SQL dashboards are now called legacy dashboards. Databricks does not recommend creating new legacy dashboards.
End of support timeline:
April 7, 2025: Official support for the legacy version of dashboards will end. Only critical security issues and service outages will be addressed.
November 3, 2025: Databricks will begin archiving legacy dashboards that have not been accessed in the past six months. Archived dashboards will no longer be accessible, and the archival process will occur on a rolling basis. Access to actively used dashboards will remain unchanged.
Databricks will work with customers to develop migration plans for active legacy dashboards after November 3, 2025.
Convert legacy dashboards using the migration tool or REST API. See Clone a legacy dashboard to an AI/BI dashboard for instructions on using the built-in migration tool. See Dashboard tutorials for tutorials on creating and managing dashboards using the REST API.
Click the  in a results tab to view more options.

Click Edit to customize the results shown in the visualization.
Click Delete to delete the results tab.
Click Duplicate to clone the results tab.
Click Add to dashboard to copy the query and visualization to a new dashboard.
This action creates a new dashboard that includes all the visualizations associated with the query. See Dashboards to learn how to edit your dashboard.
You are prompted to choose a name for the new dashboard. The new dashboard is saved to your home folder.
You can’t add results to an existing dashboard.
Click Add to legacy dashboard to add the results tab to a new or existing legacy dashboard.
Click any of the download options to download results. See the following description for details and limits.
Download results: You can download results as a CSV, TSV, or Excel file.
You can download up to approximately 1GB of results data from Databricks SQL in CSV and TSV format and up to 100,000 rows to an Excel file.
The final file download size might be slightly more or less than 1GB, as the 1GB limit is applied to an earlier step than the final file download.
Note
If you cannot download a query, your workspace administrator has disabled download for your workspace.
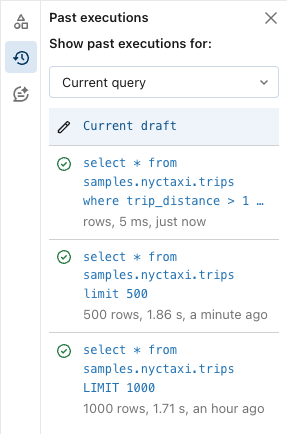
Past executions
You can view previous runs for the query, including the complete query syntax. Past executions open in read-only mode and include buttons to Clone to new query or Resume editing. This tab does not show scheduled runs.
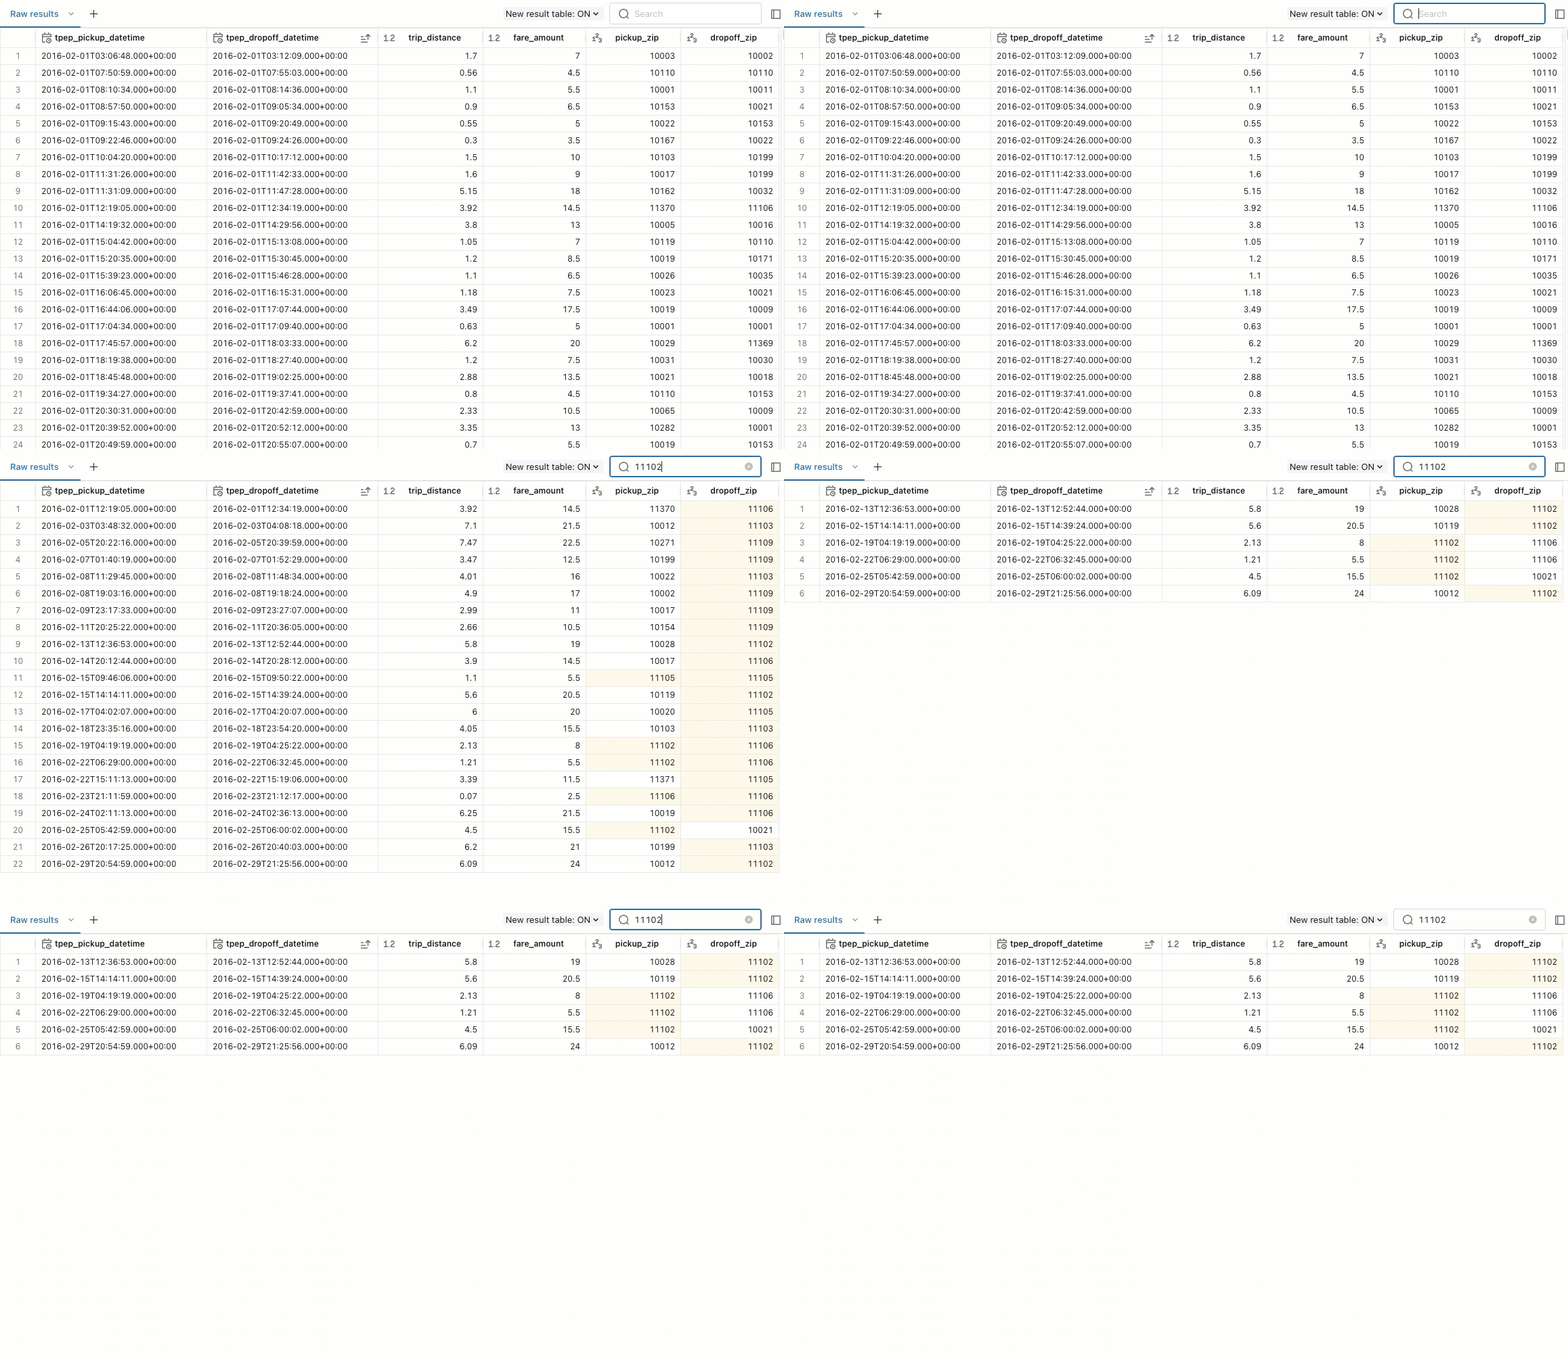
Explore results
Returned query results appear below the query. The Raw results tab populates with the returned rows. You can use built-in filters to reorder the results by ascending or descending values. You can also use the filter to search for result rows that include a specific value.
You can use tabs in the result pane to add visualizations, filters, and parameters.
Filter the list of saved queries in the queries window
In the queries window, you can filter the list of all queries by the list of queries you have created (My Queries), by favorites, and by tags.
Automate updates
You can use the Schedule button to set an automatic cadence for query runs. Automatic updates can help keep your dashboards and reports up-to-date with the most current data. Schedueled queries can also enable Databricks SQL alerts, a special type of scheduled task that sends notifications when a value reaches a specified threshold.
See Schedule a query.
Next step
See Access and manage saved queries to learn how to work with queries with the Databricks UI.