Navigate the Databricks notebook and file editor
This article describes the functions available to help you navigate the Databricks notebook and file editor, including keyboard shortcuts, code suggestions and autocomplete, variable inspection, and code folding. When you use the notebook or the file editor, Databricks Assistant is available to help you generate, explain, and debug code. See Get coding help from Databricks Assistant for details.
You can choose from a selection of editor themes. Select View > Editor theme and make a selection from the menu.
Keyboard shortcuts
To display keyboard shortcuts, select Help > Keyboard shortcuts. The keyboard shortcuts available depend on whether the cursor is in a code cell (edit mode) or not (command mode).
Command palette
You can quickly perform actions in the notebook using the command palette. To open a panel of notebook actions, click  at the lower-right corner of the workspace or use the shortcut Cmd + Shift + P on MacOS or Ctrl + Shift + P on Windows.

Find and replace text
To find and replace text within a notebook, select Edit > Find and Replace. The current match is highlighted in orange and all other matches are highlighted in yellow.
To replace the current match, click Replace. To replace all matches in the notebook, click Replace All.
To move between matches, click the Prev and Next buttons. You can also press shift+enter and enter to go to the previous and next matches, respectively.
To close the find and replace tool, click ![]() or press esc.
or press esc.
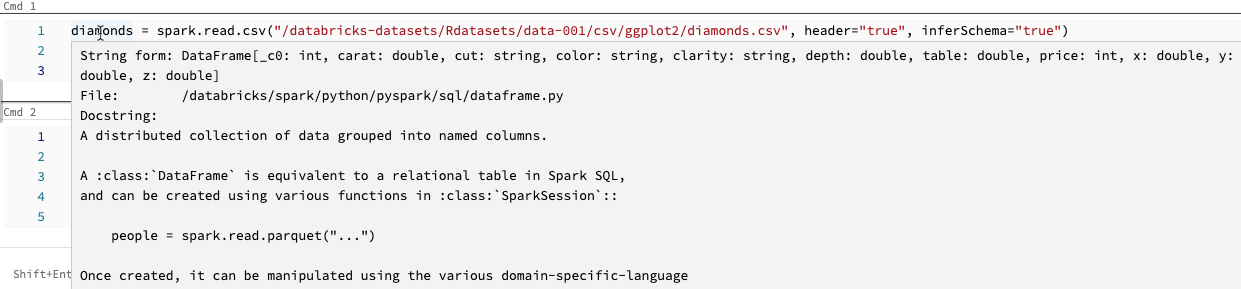
Variable inspection
To display information about a variable defined in a SQL or Python notebook, hover your cursor over the variable name. Python variable inspection requires Databricks Runtime 12.2 LTS or above.
See Variable explorer.
Go to definition
When a Python notebook is attached to a cluster, you can quickly go to the definition of a variable, function, or the code behind a %run statement. To do this, right-click the variable or function name, and then click Go to definition or Peek definition.
Hold down the Cmd key on macOS or the Ctrl key on Windows and hover over the variable or function name. If a definition is found, the name turns into a hyperlink.

The “go to definition” feature is available in Databricks Runtime 12.2 LTS and above.
Code folding
Code folding lets you temporarily hide sections of code. This can be helpful when working with long code blocks because it lets you focus on specific sections of code you are working on.
To hide code, place your cursor at the far left of a cell. Downward-pointing arrows appear at logical points where you can hide a section of code. Click the arrow to hide a code section. Click the arrow again (now pointing to the right) to show the code.
For more details, including keyboard shortcuts, see the VS Code documentation.
Multicursor support
You can create multiple cursors to make simultaneous edits easier, as shown in the video:
To create multiple cursors in a cell:
On macOS, hold down the
Optionkey and click in each location to add a cursor.On Windows, hold down the
Altkey and click in each location to add a cursor.You also have the option to change the shortcut. See Change shortcut for multicursor and column selection.
On macOS, you can create multiple vertically aligned cursors by using the keyboard shortcut Option+Command+ up or down arrow key.
Column (box) selection
To select multiple items in a column, click at the upper left of the area you want to capture. Then:
On macOS, press
Shift+Optionand drag to the lower right to capture one or more columns.On Windows, press
Shift+Altand drag to the lower right to capture one or more columns.You also have the option to change the shortcut. See Change shortcut for multicursor and column selection.
Change shortcut for multicursor and column selection
An alternate shortcut is available for multicursor and column (box) selection. With the alternate selection, the shortcuts change as follows:
To create multiple cursors in a cell:
On macOS, hold down the
Cmdkey and click in each location to add a cursor.On Windows, hold down the
Ctrlkey and click in each location to add a cursor.
To select multiple items in a column, click at the upper left of the area you want to capture. Then:
On macOS, press
Optionand drag to the lower right to capture one or more columns.On Windows, press
Altand drag to the lower right to capture one or more columns.
To enable the alternate shortcuts, do the following:
Click your username at the upper-right of the workspace, then click Settings in the dropdown list.
In the Settings sidebar, select Developer.
In the Code editor section, change the Key modifier for multi-cursor click setting to Cmd for macOS or Ctrl for Windows.
When you enable alternate shortcuts, the keyboard shortcut for creating multiple vertically aligned cursors does not change.
Browse data
Use the schema browser to explore Unity Catalog objects available for the notebook. Click ![]() at the left side of the notebook to open the schema browser.
at the left side of the notebook to open the schema browser.
The For you button displays only those objects that you’ve used in the current session or previously marked as a Favorite.
As you type text into the Filter box, the display changes to show only those objects that contain the text you type. Only objects that are currently open or have been opened in the current session appear. The Filter box does not do a complete search of the catalogs, schemas, tables, and volumes available for the notebook.
To open the  kebab menu, hover the cursor over the object’s name as shown:
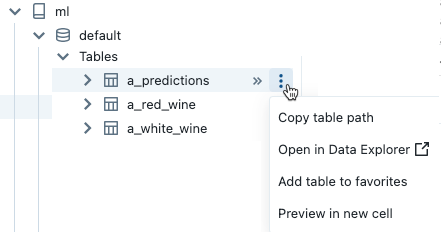
If the object is a table, you can do the following:
Automatically create and run a cell to display a preview of the data in the table. Select Preview in a new cell from the kebab menu for the table.
View a catalog, schema, or table in Catalog Explorer. Select Open in Catalog Explorer from the kebab menu. A new tab opens showing the selected object.
Get the path to a catalog, schema, or table. Select Copy … path from the kebab menu for the object.
Add a table to Favorites. Select Add to favorites from the kebab menu for the table.
If the object is a catalog, schema, or volume, you can copy the object’s path or open it in Catalog Explorer.
To insert a table or column name directly into a cell:
Click your cursor in the cell at the location you want to enter the name.
Move your cursor over the table name or column name in the schema browser.
Click the double arrow
 that appears at the right of the object’s name.
Use web terminal and Databricks CLI
To open the web terminal in a notebook, click  at the bottom of the right sidebar.
Use Databricks CLI in a web terminal
Starting with Databricks Runtime 15.0, you can use the Databricks CLI from the web terminal in the notebook.
Requirements
The notebook must be attached to a cluster in Single user or No isolation shared access mode.
The CLI is not available in workspaces enabled for Private Service Connect.
The installed CLI is always the latest version. Authentication is based on the current user.
You cannot use the CLI from a notebook cell. In a notebook, commands like %sh databricks ... do not work with Databricks Runtime 15.0 or above.
Personalized autocomplete
Autocomplete automatically completes code segments as you type them. Completable objects include types, classes, and objects, as well as SQL database and table names. Databricks uses your Unity Catalog metadata and usage to personalize suggestions.
For Python cells, the notebook must be attached to a cluster for autocomplete to work, and you must run all cells that define completable objects.
For SQL cells, autocomplete suggests keywords and basic syntax even if the notebook is not attached to any compute resource.
If the workspace is enabled for Unity Catalog, autocomplete also suggests catalog, schema, table, and column names for tables in Unity Catalog.
If the workspace is not enabled for Unity Catalog, the notebook must be attached to a cluster or a SQL warehouse to suggest table or column names.
Autocomplete suggestions automatically appear when you type in a cell. Use the up and down arrow keys or your mouse to select a suggestion, and press Tab or Enter to insert the selection into the cell.
Note
Server autocomplete in R notebooks is blocked during command execution.
There are two user settings to be aware of:
To turn off autocomplete suggestions, toggle Autocomplete as you type. When autocomplete is off, you can display autocomplete suggestions by pressing Ctrl + Space.
To prevent Enter from inserting autocomplete suggestions, toggle Enter key accepts autocomplete suggestions.
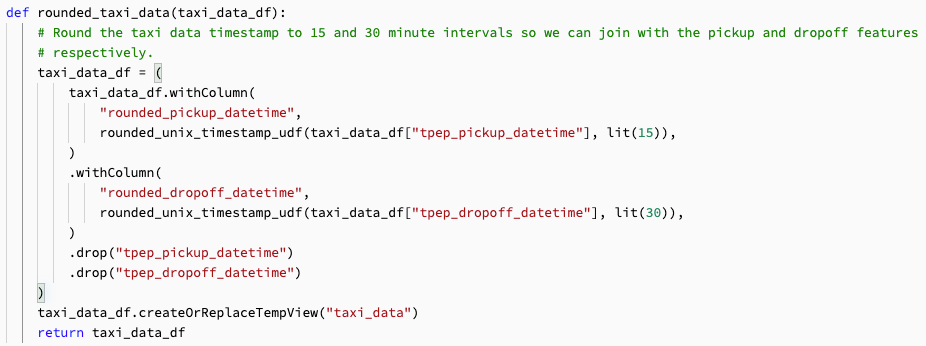
Bracket matching
When you click near a parenthesis, square bracket, or curly brace, the editor highlights that character and its matching bracket.
Python error highlighting
When a notebook is connected to a cluster, syntax errors are underlined in red. For Python, the cluster must be running Databricks Runtime 12.2 LTS or above.
Hover the syntax warning and select Quick Fix for possible actions.

Workspaces with Databricks Assistant enabled can also select Fix with Assistant for AI-assisted suggestions.
To enable or disable syntax error highlighting, do the following:
Click your username at the upper-right of the workspace, then click Settings in the dropdown list.
In the Settings sidebar, select Developer.
In the Code editor section, toggle the setting for SQL syntax error highlighting or Python syntax error highlighting.
Python formatting highlighting
Python code formatting errors and warnings are underlined in yellow. Hover over the syntax warnings to see more information. The cluster must be running Databricks Runtime 12.1 LTS or above.
To enable formatting errors and warnings:
Click your username at the upper-right of the workspace, then click Settings in the dropdown list.
In the Settings sidebar, select Developer.
In the Experimental features section, toggle the setting for Python format error highlighting.