レガシービジュアライゼーション
この記事では、従来の Databricks の視覚化について説明します。 現在の視覚化のサポートについては、「 Databricks ノートブックの視覚化 」を参照してください。
Databricks は、Python と R の視覚化ライブラリもネイティブにサポートしており、サードパーティのライブラリをインストールして使用できます。
レガシービジュアライゼーションの作成
結果セルからレガシー ビジュアライゼーションを作成するには、[ + ] をクリックし、[ レガシー ビジュアライゼーション] を選択します。
レガシービジュアライゼーションは、豊富なプロットタイプのセットをサポートしています。
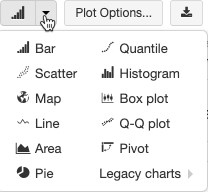
レガシーチャートツールバー
折れ線グラフと棒グラフの両方に、クライアント側の豊富な対話セットをサポートする組み込みのツール バーがあります。
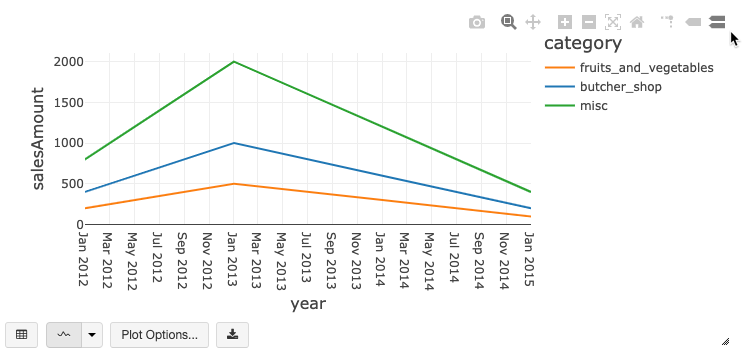
チャートを設定するには、[ プロット オプション...] をクリックします。
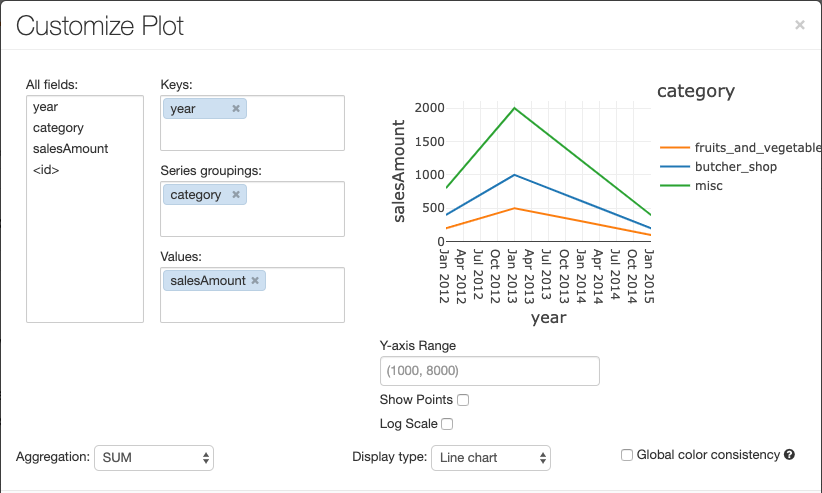
折れ線グラフには、Y 軸の範囲の設定、ポイントの表示と非表示、対数スケールによる Y 軸の表示など、いくつかのカスタム グラフ オプションがあります。
従来のグラフの種類に関する情報については、以下を参照してください。
グラフ間での色の一貫性
Databricks では、系列セットとグローバルという 2 種類のレガシ グラフ間で色の一貫性がサポートされています。
系列セットの色の一貫性は、同じ値で順序が異なる系列 がある場合 (たとえば、A = ["Apple", "Orange", "Banana"] と B = ["Orange", "Banana", "Apple"]の場合)、同じ色を同じ値に割り当てます。値はプロット前にソートされるため、両方の凡例が同じ方法でソートされ(["Apple", "Banana", "Orange"])、同じ値に同じ色が付けられます。 ただし、シリーズC = ["Orange", "Banana"]の場合、セットが同じではないため、セットAと色が一致しません。 並べ替えアルゴリズムは、最初の色をセットCの「バナナ」に割り当て、2番目の色をセットAの「バナナ」に割り当てます。これらの系列を色の一貫性を持たせる場合は、グラフのグローバルな色の一貫性を保つように指定できます。
グローバルな 色の一貫性では、系列の値に関係なく、各値は常に同じ色にマップされます。各グラフでこれを有効にするには、[ グローバル色の一貫性 ] チェック ボックスをオンにします。

注
この一貫性を実現するために、Databricks は値から色に直接ハッシュします。 衝突 (2 つの値がまったく同じ色になる) を回避するために、ハッシュは大きな色のセットに対して行われ、見栄えの良い色や簡単に区別できる色を保証できないという副作用があります。多くの色で、非常によく似た外観のいくつかがあるはずです。
機械学習のビジュアライゼーション
標準のグラフの種類に加えて、レガシ ビジュアライゼーションでは、次の機械学習トレーニング パラメーターと結果がサポートされています。
残 差
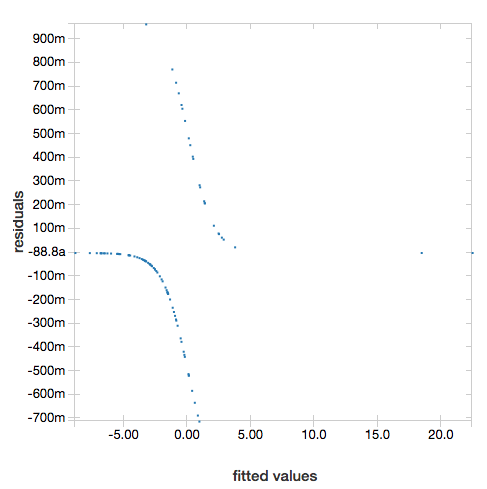
線形回帰とロジスティック回帰では、 適合対残差 プロットをレンダリングできます。 このプロットを取得するには、モデルと DataFrameを指定します。
次の例では、住宅販売価格データに対する都市の人口に対して線形回帰を実行し、残差と適合データを表示します。
# Load data
pop_df = spark.read.csv("/databricks-datasets/samples/population-vs-price/data_geo.csv", header="true", inferSchema="true")

# Drop rows with missing values and rename the feature and label columns, replacing spaces with _
from pyspark.sql.functions import col
pop_df = pop_df.dropna() # drop rows with missing values
exprs = [col(column).alias(column.replace(' ', '_')) for column in pop_df.columns]

# Register a UDF to convert the feature (2014_Population_estimate) column vector to a VectorUDT type and apply it to the column.
from pyspark.ml.linalg import Vectors, VectorUDT

spark.udf.register("oneElementVec", lambda d: Vectors.dense([d]), returnType=VectorUDT())
tdata = pop_df.select(*exprs).selectExpr("oneElementVec(2014_Population_estimate) as features", "2015_median_sales_price as label")

# Run a linear regression
from pyspark.ml.regression import LinearRegression

lr = LinearRegression()
modelA = lr.fit(tdata, {lr.regParam:0.0})

# Plot residuals versus fitted data
display(modelA, tdata)

ROC 曲線
ロジスティック回帰では、 ROC 曲線をレンダリングできます。 このプロットを取得するには、モデル、 fit メソッドに入力される準備済みデータ、およびパラメーター "ROC"を指定します。
次の例では、個人が個人のさまざまな属性から年間<=50Kまたは>50kを稼ぐかどうかを予測する分類器を開発します。 Adult データセットは国勢調査データから取得され、48842 人の個人とその年収に関する情報で構成されています。
このセクションのコード例では、ワンホット エンコードを使用します。
# This code uses one-hot encoding to convert all categorical variables into binary vectors.

schema = """`age` DOUBLE,
`workclass` STRING,
`fnlwgt` DOUBLE,
`education` STRING,
`education_num` DOUBLE,
`marital_status` STRING,
`occupation` STRING,
`relationship` STRING,
`race` STRING,
`sex` STRING,
`capital_gain` DOUBLE,
`capital_loss` DOUBLE,
`hours_per_week` DOUBLE,
`native_country` STRING,
`income` STRING"""

dataset = spark.read.csv("/databricks-datasets/adult/adult.data", schema=schema)

from pyspark.ml import Pipeline
from pyspark.ml.feature import OneHotEncoder, StringIndexer, VectorAssembler

categoricalColumns = ["workclass", "education", "marital_status", "occupation", "relationship", "race", "sex", "native_country"]

stages = [] # stages in the Pipeline
for categoricalCol in categoricalColumns:
    # Category indexing with StringIndexer
    stringIndexer = StringIndexer(inputCol=categoricalCol, outputCol=categoricalCol + "Index")
    # Use OneHotEncoder to convert categorical variables into binary SparseVectors
    encoder = OneHotEncoder(inputCols=[stringIndexer.getOutputCol()], outputCols=[categoricalCol + "classVec"])
    # Add stages.  These are not run here, but will run all at once later on.
    stages += [stringIndexer, encoder]

# Convert label into label indices using the StringIndexer
label_stringIdx = StringIndexer(inputCol="income", outputCol="label")
stages += [label_stringIdx]

# Transform all features into a vector using VectorAssembler
numericCols = ["age", "fnlwgt", "education_num", "capital_gain", "capital_loss", "hours_per_week"]
assemblerInputs = [c + "classVec" for c in categoricalColumns] + numericCols
assembler = VectorAssembler(inputCols=assemblerInputs, outputCol="features")
stages += [assembler]

# Run the stages as a Pipeline. This puts the data through all of the feature transformations in a single call.

partialPipeline = Pipeline().setStages(stages)
pipelineModel = partialPipeline.fit(dataset)
preppedDataDF = pipelineModel.transform(dataset)

# Fit logistic regression model

from pyspark.ml.classification import LogisticRegression
lrModel = LogisticRegression().fit(preppedDataDF)

# ROC for data
display(lrModel, preppedDataDF, "ROC")

残差を表示するには、 "ROC" パラメーターを省略します。
display(lrModel, preppedDataDF)
決定木
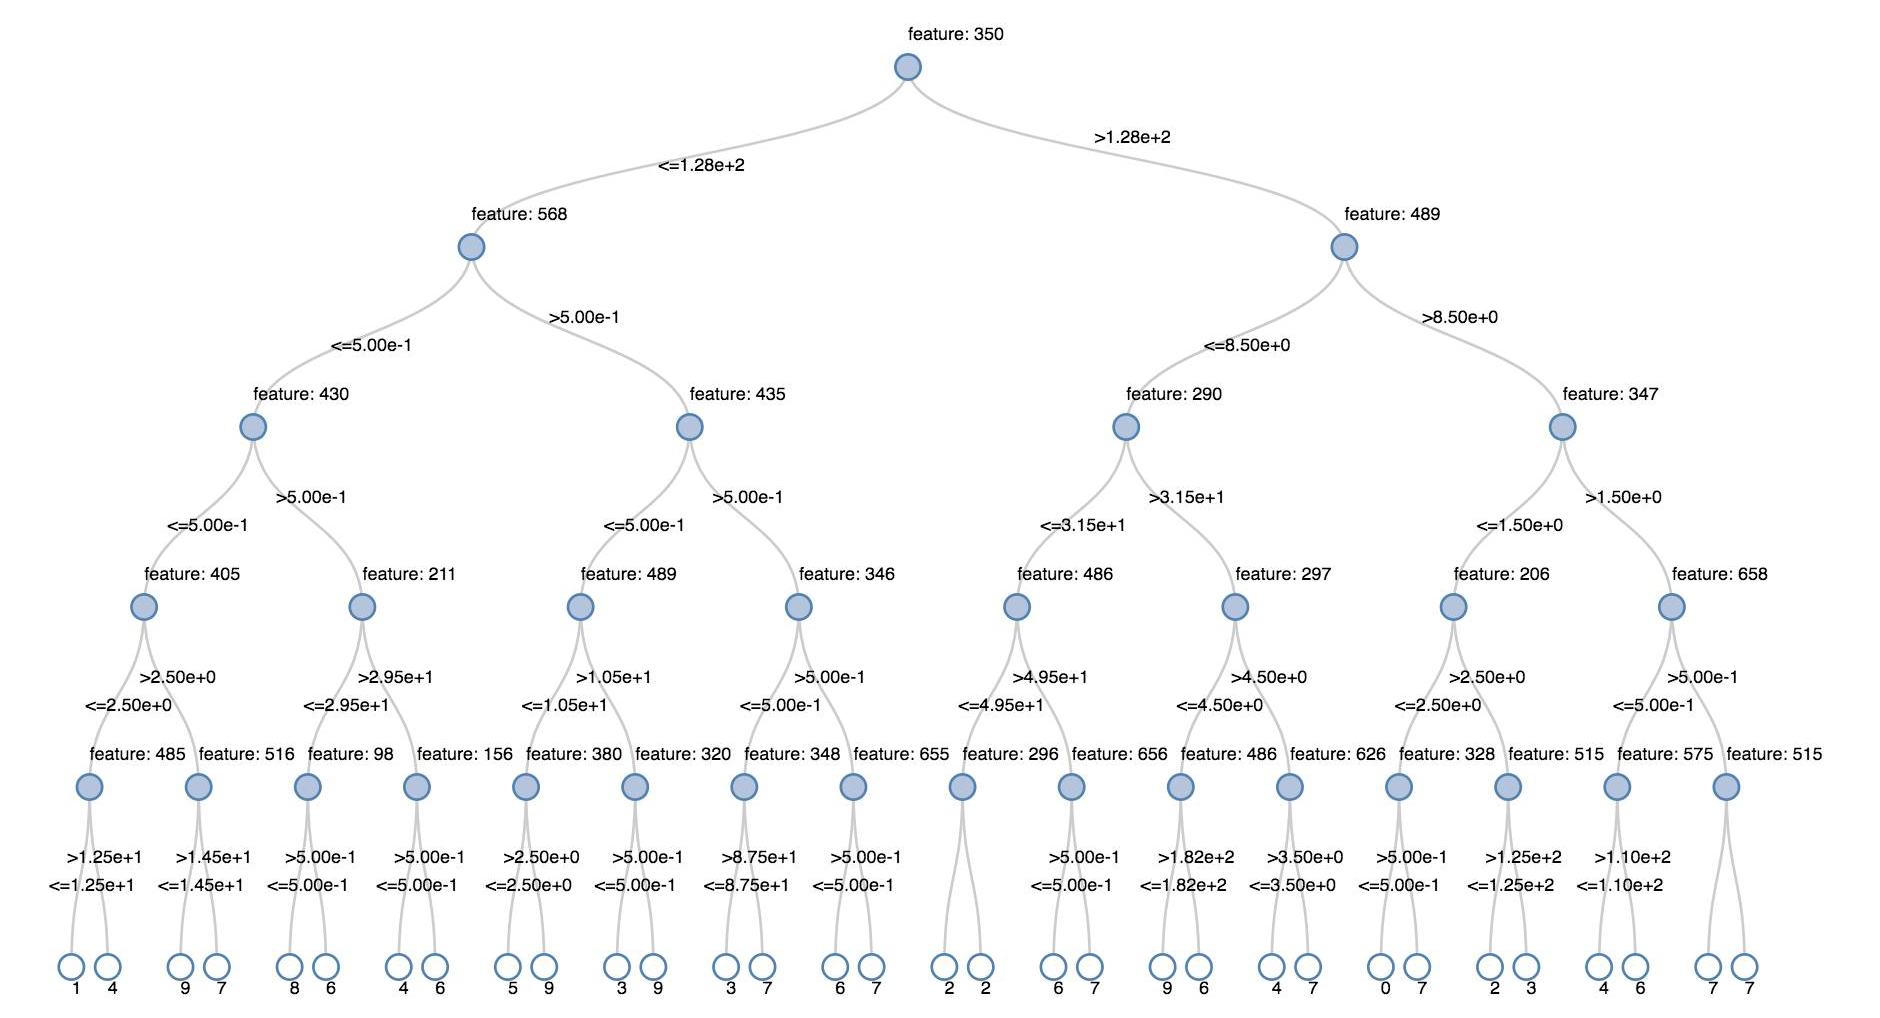
従来のビジュアライゼーションは、決定木のレンダリングをサポートします。
この視覚化を取得するには、決定木モデルを指定します。
次の例では、手書き数字の画像の MNIST データセットから数字 (0 から 9) を認識し、ツリーを表示するようにツリーをトレーニングします。
trainingDF = spark.read.format("libsvm").load("/databricks-datasets/mnist-digits/data-001/mnist-digits-train.txt").cache()
testDF = spark.read.format("libsvm").load("/databricks-datasets/mnist-digits/data-001/mnist-digits-test.txt").cache()

from pyspark.ml.classification import DecisionTreeClassifier
from pyspark.ml.feature import StringIndexer
from pyspark.ml import Pipeline

indexer = StringIndexer().setInputCol("label").setOutputCol("indexedLabel")

dtc = DecisionTreeClassifier().setLabelCol("indexedLabel")

# Chain indexer + dtc together into a single ML Pipeline.
pipeline = Pipeline().setStages([indexer, dtc])

model = pipeline.fit(trainingDF)
display(model.stages[-1])
val trainingDF = spark.read.format("libsvm").load("/databricks-datasets/mnist-digits/data-001/mnist-digits-train.txt").cache
val testDF = spark.read.format("libsvm").load("/databricks-datasets/mnist-digits/data-001/mnist-digits-test.txt").cache

import org.apache.spark.ml.classification.{DecisionTreeClassifier, DecisionTreeClassificationModel}
import org.apache.spark.ml.feature.StringIndexer
import org.apache.spark.ml.Pipeline

val indexer = new StringIndexer().setInputCol("label").setOutputCol("indexedLabel")
val dtc = new DecisionTreeClassifier().setLabelCol("indexedLabel")
val pipeline = new Pipeline().setStages(Array(indexer, dtc))

val model = pipeline.fit(trainingDF)
val tree = model.stages.last.asInstanceOf[DecisionTreeClassificationModel]

display(tree)
構造化ストリーミング DataFrames
ストリーミングクエリーの結果をリアルタイムで視覚化するには、Scala と Python で構造化ストリーミング DataFrame display します。
streaming_df = spark.readStream.format("rate").load()
display(streaming_df.groupBy().count())
val streaming_df = spark.readStream.format("rate").load()
display(streaming_df.groupBy().count())
display は、次の省略可能なパラメーターをサポートします。
streamName: ストリーミング クエリー名。trigger(Scala) およびprocessingTime(Python): ストリーミング クエリが実行される頻度を定義します。 指定しない場合、前の処理が完了するとすぐに、新しいデータが使用可能かどうかがチェックされます。 本番運用のコストを削減するために、 Databricksでは常にトリガー間隔を設定することをお勧めします。 デフォルトのトリガー間隔は 500 ミリ秒です。checkpointLocation: システムがすべてのチェックポイント情報を書き込む場所。 指定しない場合、システムは DBFS に一時的なチェックポイントの場所を自動的に生成します。 ストリームが中断したところからデータの処理を続行するには、チェックポイントの場所を指定する必要があります。 Databricks では、運用環境で は常にcheckpointLocationオプションを指定することをお勧めします。
streaming_df = spark.readStream.format("rate").load()
display(streaming_df.groupBy().count(), processingTime = "5 seconds", checkpointLocation = "dbfs:/<checkpoint-path>")
import org.apache.spark.sql.streaming.Trigger

val streaming_df = spark.readStream.format("rate").load()
display(streaming_df.groupBy().count(), trigger = Trigger.ProcessingTime("5 seconds"), checkpointLocation = "dbfs:/<checkpoint-path>")
これらのパラメーターの詳細については、「 ストリーミングの開始クエリー」を参照してください。
displayHTML 機能
Databricks プログラミング言語ノートブック (Python、R、および Scala) は、 displayHTML 関数を使用した HTML グラフィックスをサポートします。この関数には、任意の HTML、CSS、または JavaScript コードを渡すことができます。 この関数は、D3 などの JavaScript ライブラリを使用した対話型グラフィックスをサポートします。
displayHTMLの使用例については、以下を参照してください。
注
displayHTML iframe はドメイン databricksusercontent.comから提供され、iframe サンドボックスには allow-same-origin 属性が含まれます。databricksusercontent.com ブラウザからアクセスできる必要があります。 現在、企業ネットワークによってブロックされている場合は、許可リストに追加する必要があります。
画像
イメージ データ型を含む列は、リッチ HTML としてレンダリングされます。 Databricks は、Spark イメージスキーマに一致する DataFrame 列の イメージ サムネイルのレンダリングを試みます。 サムネイルレンダリングは、 spark.read.format('image') 関数を介して正常に読み込まれたすべての画像に対して機能します。 他の方法で生成されたイメージ値の場合、Databricks は 1、3、または 4 つのチャンネル イメージ (各チャンネルは 1 バイトで構成されます) のレンダリングをサポートしますが、次の制約があります。
1 チャンネル画像:
modeフィールドは 0 に等しくなければなりません。height、width、およびnChannelsフィールドは、dataフィールドのバイナリ画像データを正確に記述する必要があります。3 チャンネル画像:
modeフィールドは 16 に等しくなければなりません。height、width、およびnChannelsフィールドは、dataフィールドのバイナリ画像データを正確に記述する必要があります。dataフィールドには、3 バイトのチャンクのピクセル データを含める必要があり、各ピクセルのチャンネル順序(blue, green, red)が含まれます。4 チャンネル画像:
modeフィールドは 24 に等しくなければなりません。height、width、およびnChannelsフィールドは、dataフィールドのバイナリ画像データを正確に記述する必要があります。dataフィールドには、4 バイトのチャンクのピクセル データが含まれ、各ピクセルのチャンネル順序(blue, green, red, alpha)が含まれている必要があります。
Pythonでのビジュアライゼーション
このセクションの内容:
Seaborn
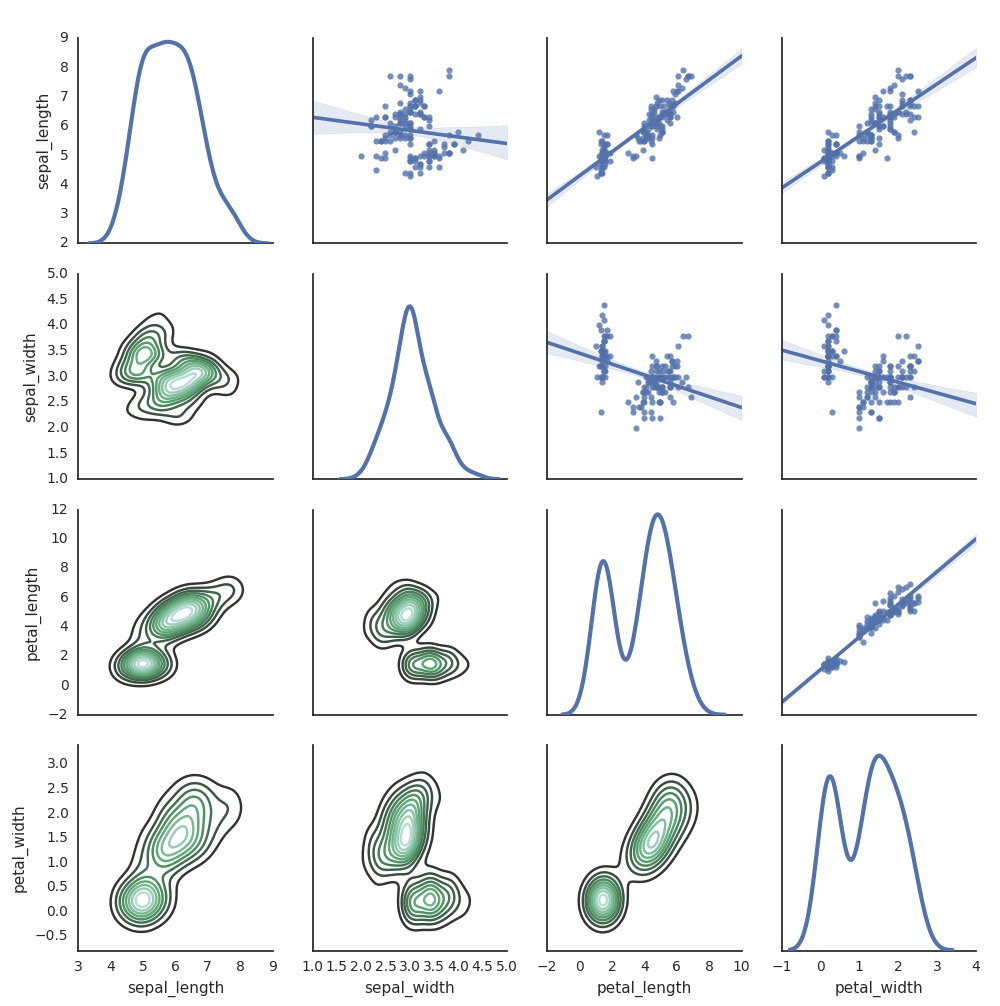
他のPythonライブラリを使用してプロットを生成することもできます。 Databricks Runtime には、 seaborn ビジュアライゼーションライブラリが含まれています。seabornプロットを作成するには、ライブラリをインポートし、プロットを作成して、プロットを display 関数に渡します。
import seaborn as sns
sns.set(style="white")

df = sns.load_dataset("iris")
g = sns.PairGrid(df, diag_sharey=False)
g.map_lower(sns.kdeplot)
g.map_diag(sns.kdeplot, lw=3)

g.map_upper(sns.regplot)

display(g.fig)
Rでのビジュアライゼーション
R でデータをプロットするには、次のように display 関数を使用します。
library(SparkR)
diamonds_df <- read.df("/databricks-datasets/Rdatasets/data-001/csv/ggplot2/diamonds.csv", source = "csv", header="true", inferSchema = "true")

display(arrange(agg(groupBy(diamonds_df, "color"), "price" = "avg"), "color"))
デフォルトの R プロット 関数を使用できます。
fit <- lm(Petal.Length ~., data = iris)
layout(matrix(c(1,2,3,4),2,2)) # optional 4 graphs/page
plot(fit)
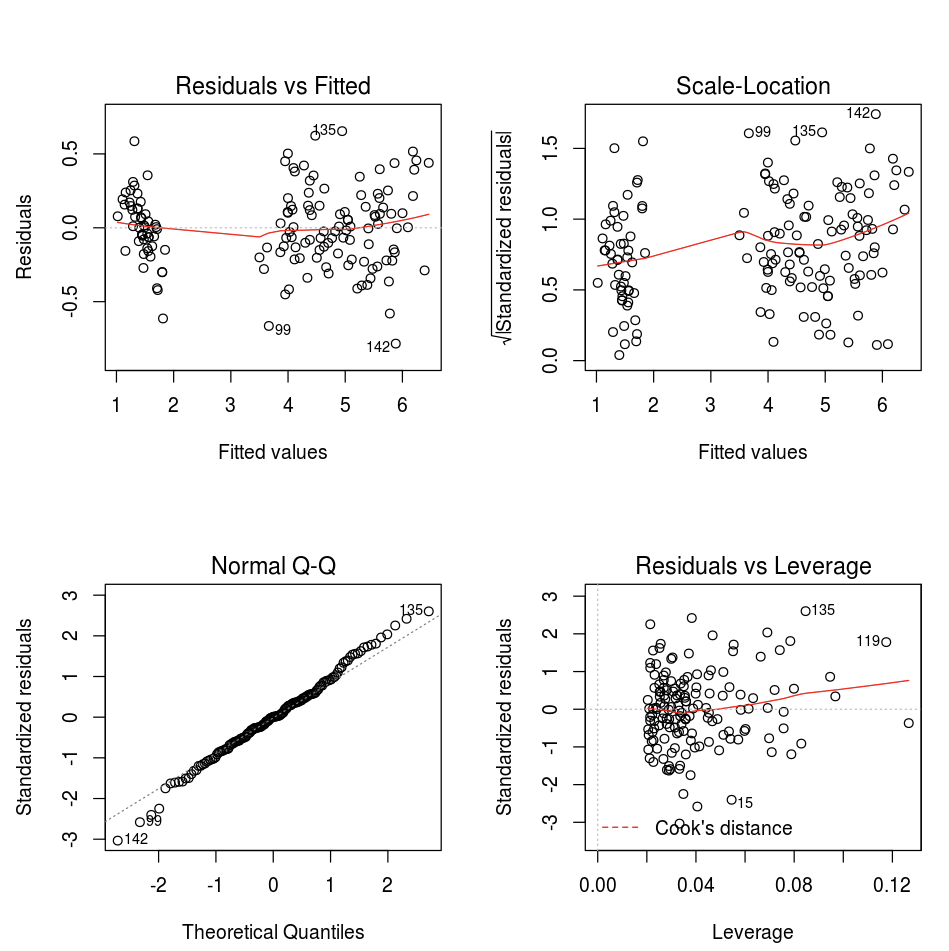
任意の R 視覚化パッケージを使用することもできます。 R ノートブックは、結果のプロットを .png としてキャプチャし、インラインで表示します。
このセクションの内容:
Lattice
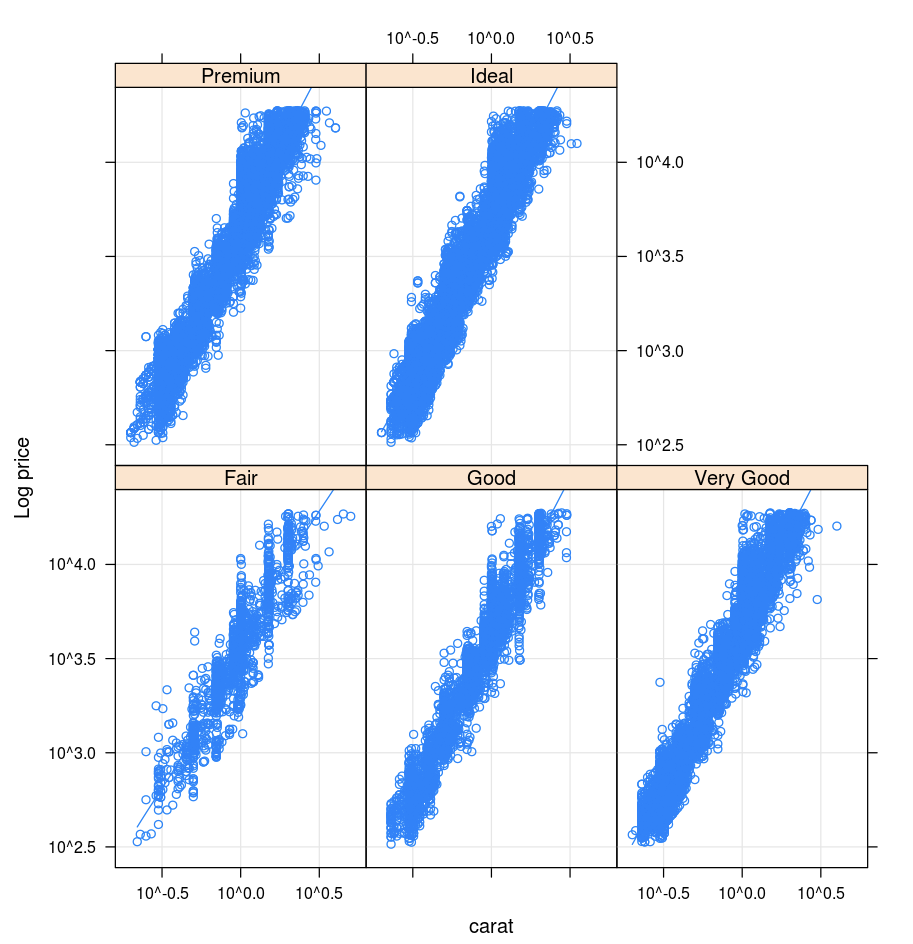
ラティス パッケージはトレリスグラフ(変数または変数間の関係を1つ以上の他の変数を条件とするグラフ)をサポートしています。
library(lattice)
xyplot(price ~ carat | cut, diamonds, scales = list(log = TRUE), type = c("p", "g", "smooth"), ylab = "Log price")
DandEFA
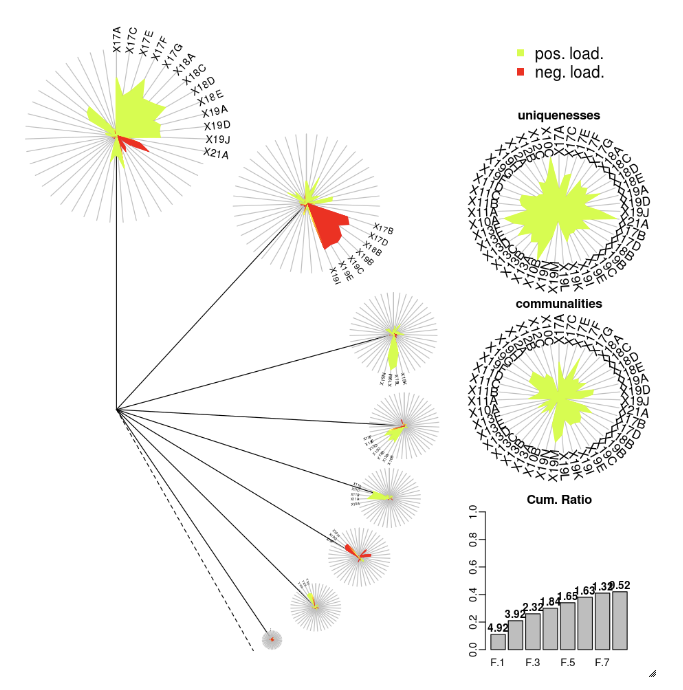
DandEFA パッケージはタンポポのプロットをサポートしています。
install.packages("DandEFA", repos = "https://cran.us.r-project.org")
library(DandEFA)
data(timss2011)
timss2011 <- na.omit(timss2011)
dandpal <- rev(rainbow(100, start = 0, end = 0.2))
facl <- factload(timss2011,nfac=5,method="prax",cormeth="spearman")
dandelion(facl,bound=0,mcex=c(1,1.2),palet=dandpal)
facl <- factload(timss2011,nfac=8,method="mle",cormeth="pearson")
dandelion(facl,bound=0,mcex=c(1,1.2),palet=dandpal)
Plotly
Plotly R パッケージは R 用の htmlwidgets に依存しています。インストール手順とノートブックについては、 htmlwidgets を参照してください。
Scalaでのビジュアライゼーション
Scala でデータをプロットするには、次のように display 関数を使用します。
val diamonds_df = spark.read.format("csv").option("header","true").option("inferSchema","true").load("/databricks-datasets/Rdatasets/data-001/csv/ggplot2/diamonds.csv")

display(diamonds_df.groupBy("color").avg("price").orderBy("color"))
 をクリックします。
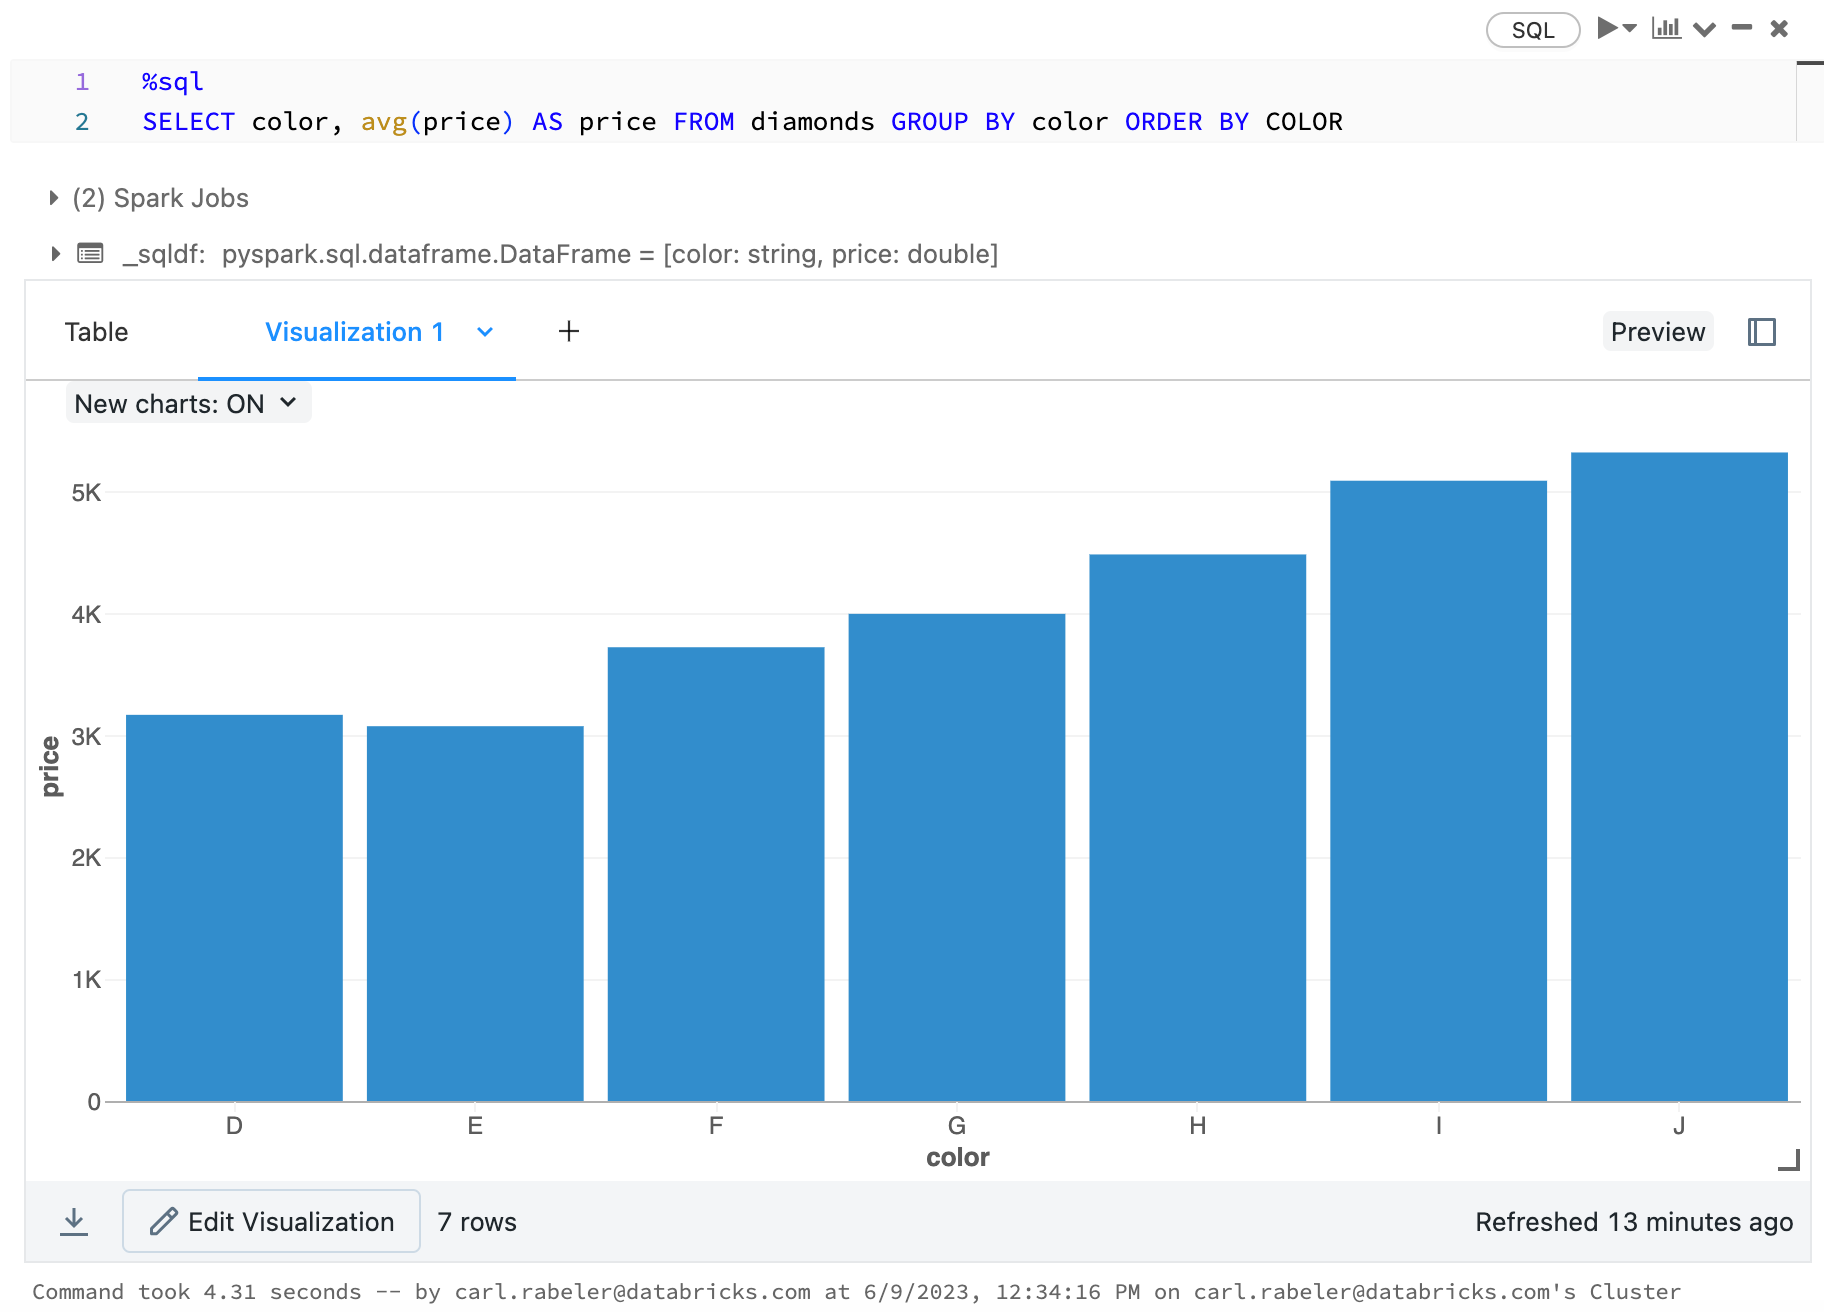
 別のプロットタイプを選択するには、棒グラフ の右側をクリックし
